Chris McDowall: There are three pure science Crown Research Institutes in New Zealand. GNS looks after geological phenomena. NIWA studies water in all its various forms. And Landcare Research, where I worked for four years, is concerned with soils, flora, and fauna. Maps play a really special role within that workplace. And I’d often find some combination of Garth and Pierre and Caroline and Marino leaning over a roughly-printed topographic map or a hand-drawn chart. And together we’d gesture and point and nod and disagree, tracing lines with our fingers and pointing out inconsistencies with ballpoint pens.
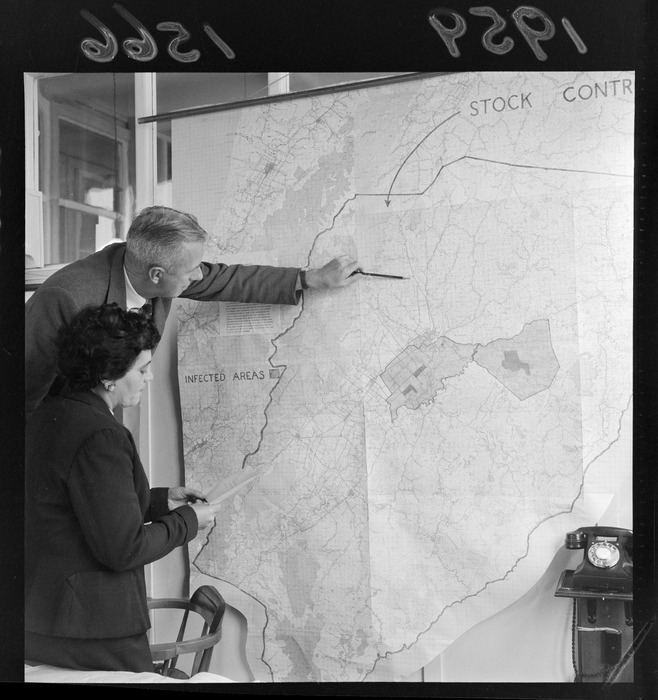
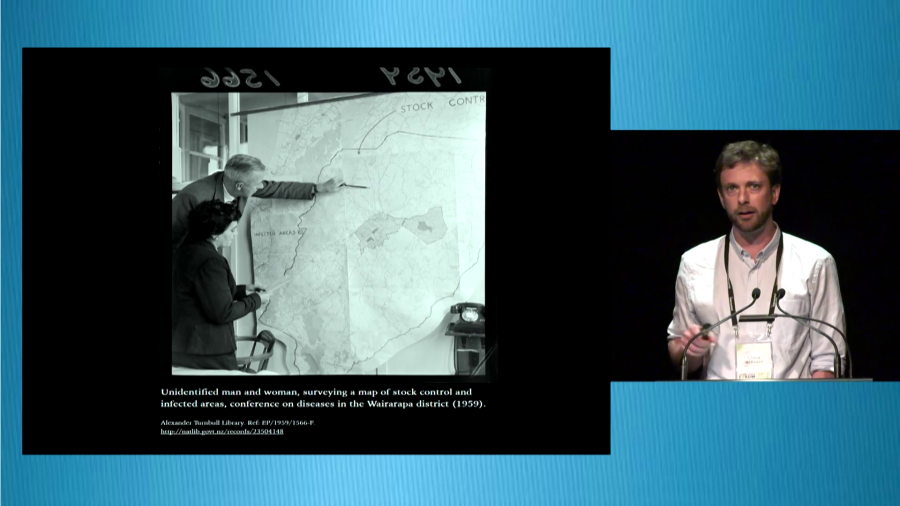
Unidentifiefd man and woman, surveying a map of stock control and infected areas, conference on diseases in the Wairarapa district, Wellington. Negatives of the Evening Post newspaper. Ref: EP/1959/1566‑F. Alexander Turnbull Library, Wellington, New Zealand. http://natlib.govt.nz/records/23504148
And by talking through the map, we developed a shared understanding of our respective problem domains. And those graphical props, they rarely lived longer than a few hours. Although on occasion a landscape profile sketched on the back of a pie packet proved so valuable that it would actually get filed away. But the power of those artifacts was largely in their transience. And being ephemeral, it encouraged us to scribble and cross out and annotate, all the while narrating our thought processes to one another.
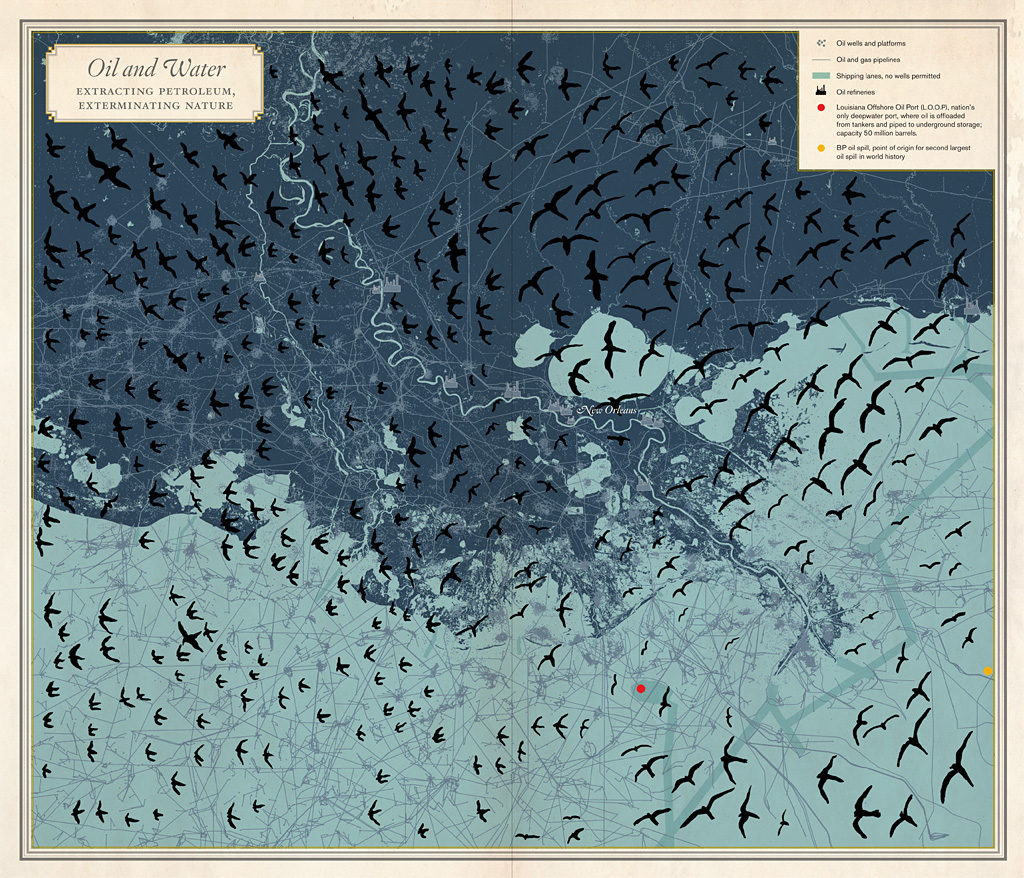
Rebecca Solnit is perhaps best known as a really insightful essayist. But she’s also collaborated with cartographers on two published atlases. This map of oil infrastructure and bird migration from her atlas of New Orleans is one of my favorites.
Maps allow me to make propositions about cities and places as nothing else does.
Rebecca Solnit, “The Appetite for Maps: Cartographic Hungers and Feasts”, University of California Berkeley, 2013 at 40:57 [presentation slide]
And last week I watched this YouTube clip of her delivering a lecture where she made the statement that “maps allow me to make propositions about cities and places as nothing else does.” And it brought to mind my time as a scientist and how much my colleagues and I learnt from the act of creating and talking about and these throwaway data visualizations with one another.
And it made me reflect that with the possible exception of web site analytics, I don’t see this happening to nearly the same degree within memory institutions like the ones that we work within. And that’s not to say that it doesn’t happen, more that unlike in the sciences, these activities tend to be clustered in specific contexts or individuals, rather than practiced by everyone as a matter of course. And I wonder what it would look like if we folded these modes of inquiry and representation into our everyday practices of working with our colleagues and collections.
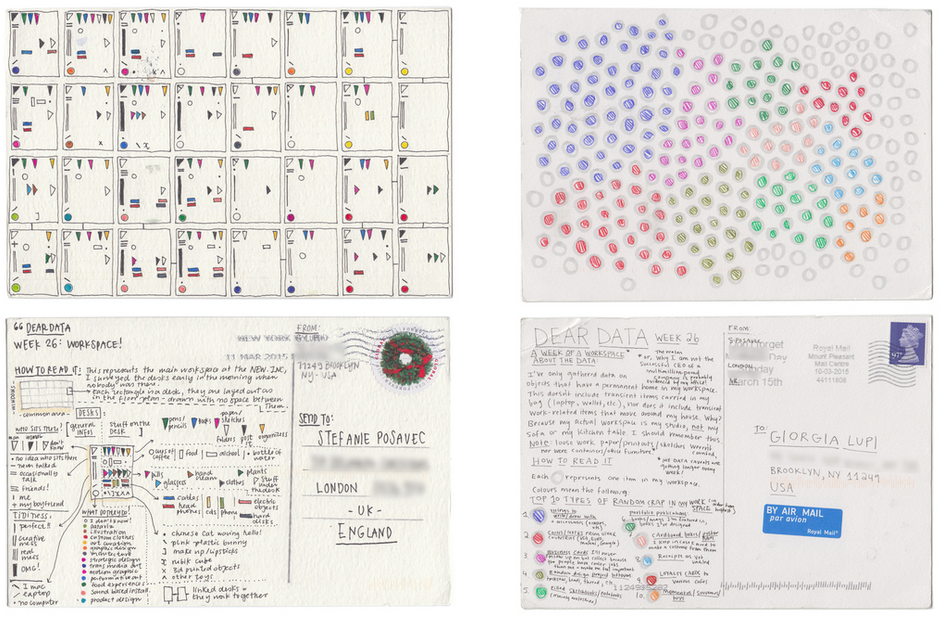
Screenshot from Dear Data, “Week 26: A week of workspace”
And these are some things that inspire me. This is one entry from the wonderful Dear Data project, where each week Georgia Lupi and Stefanie Posavec, they pick a theme and they spend a week collecting data and then creating a visual representation of some aspect of that theme, and send the other the result as a visual data postcard.
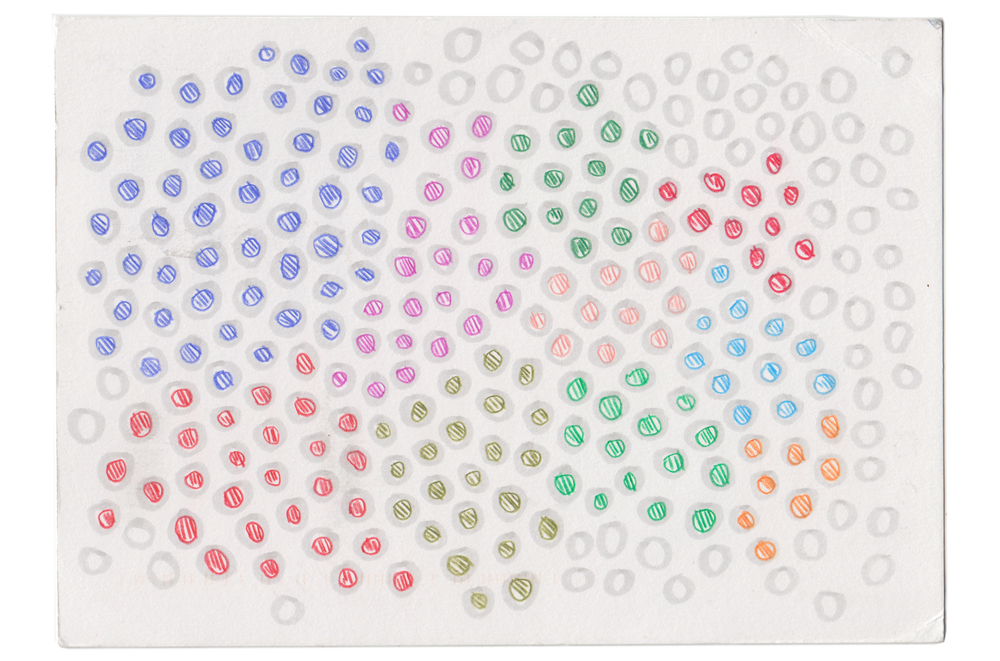
Here Stefanie is showing the individual items that have accumulated on the desk in her office workspace. So, something incredibly mundane. And each circle represents an object, and the top ten types of items are assigned a color. But what intrigues me is Stefanie commentary when she observes that through the act of constructing this, she realized that “the items on my desk are more of an indication of my personality, hopes and insecurities, than I’d ever realized.”
most of the items on my desk aren’t really essential for work, but are there for more emotional reasons. And these items are large quantities of little tiny items that are scattered around my desk in a haphazard way. So I hang onto business cards that people who are in jobs more interesting and glamorous than mine give me, as it makes me feel that I’m one of their peers (silly, I know). Or I always empty out my wallet on my desk to remove all the coins and notes I pick up from the countries I visit on my travels, so these are found here too, functioning as aides-mémoires of past adventures.
Stefanie Posavec, Dear Data “Week 26: A week of workspace”
Kate Hannah, who spoke just a moment ago, together we just recently started something called the Data Poets Society. And every couple of months, we gather at the University of Auckland over drinks and food to share interesting data visualizations and learn from others. Talk to one of us if you’d like to become involved.
https://twitter.com/Knhannah/status/649140346534825984
Last month, Kate shared this lo-fi delight, which is a gendered history of science prizes in New Zealand. Presenting the data as a chart on a whiteboard allowed others to physically point at different parts of the plot, making observations or asking for clarification. And the interplay between the verbal narration and the pen on the wall graphic provided insights into both the nature of the data and into Kate’s thinking processes.
And that’s really valuable. I think it’s worth just quickly making a distinction between visual thinking and visual communication, because these modes of working with data, they get confused but I think that they’re distinct.
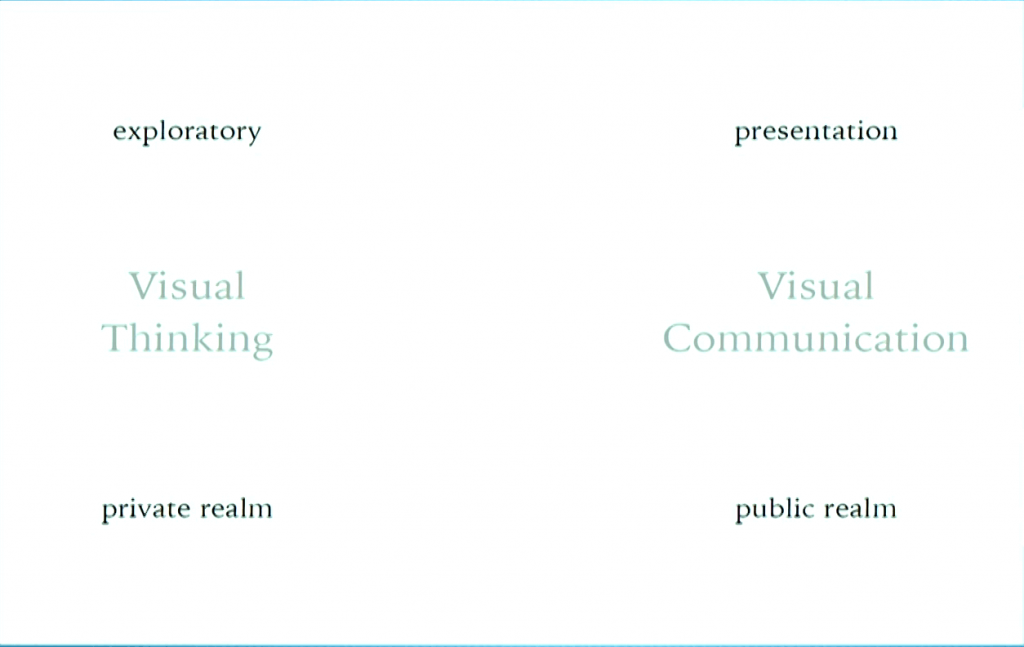
Visual thinking, which is what I’m talking about, happens in private. It’s you alone, or you and a colleague in the next desk, or a small group crowded around a laptop. It’s tentative, it’s messy and exploratory, and values quick iteration over correctness.
Visual communication happens once you understand what you’re working with and are ready to communicate this to an audience. It’s refined, it’s reduced to a handful of dimensions, and it’s often performative. Visual communication’s the realm of the professional designer. But I think that visual thinking is for everyone.
Sometimes I think about these sorts of working graphics as a sort of mental scaffolding. In the act of rendering data, or drawing our thoughts, we assemble a construct to hang other concepts from. So it’s a construct that can be extended or modified or disassembled and turned into something new. Scaffolds are frameworks that help us to build more permanent structures. And graphics are a means to explore ideas and discover what we really think about something.
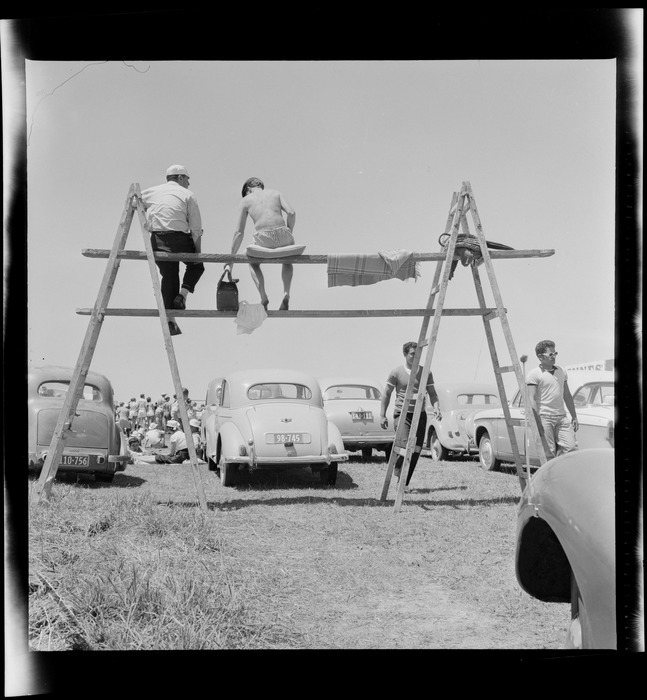
Men sitting on a make-shift scaffolding, watching race, at the New Zealand Grand Prix, Ardmore Airport, Manukau, Auckland. Further negatives of the Evening Post newspaper. Ref: EP/1960/0105–0113-1‑F. Alexander Turnbull Library, Wellington, New Zealand. http://natlib.govt.nz/records/30646962
This talk came about because two nights ago, I was reflecting on an exercise that Digital New Zealand and the National Library online teams participated in earlier this year. Andy asked that each person create a paper or a digital visualization of some aspect of our job or the collections or services that we work with. We had one month to make something. And at the end of that month, we gathered and we shared the things that we’d made.
I explored some aspect of our system that had been bothering me, and I put together some…bloody scatter plot hex bin…thing. And that was fine. But the amazing moment happened right at the end, where the last person up appeared really quite uncertain about what she’d made. And she walked to the front of the room, and she hung up this large piece of white butcher paper. And, sorry this is surprisingly emotional, because I was blown away.
It was covered in a felt-tip pen rendering of our metadata harvesting system. And it was seen from her perspective. And it had these small little yellow Post-it notes where she traced the paths that the metadata documents, where they move through the various systems and layers of technology. And punctuating this flow, she’d indicated the various circumstances and contexts where a human might touch that metadata.
And I played a really big role in designing the system that she was describing. But I had never seen it like that. I’d never seen it through the eyes of the person who was driving it. And this graphic became this incredibly useful prop for her to narrate her experience. And it was this space for her to convey the depth of her experience, and to help the rest of the team reach this shared understanding.
But there’s something a little bit more than that. Because, you know when someone presents something and you can see that they’re uncertain about how it’s going to be received. And then they get into it. And what they are saying is absolutely fascinating to everyone in the room, and you feel your fellow audience members getting hooked in, and this sort of glow comes off them and it pushes that to the speaker. Which emboldens them further, and then the talk gets better and better. And this is what happened to this colleague of mine.
And something about giving the space where she could demonstrate her mastery of the system and the integrity with which she treats her job, it just blew me away. And I hope that you can have similar experiences like that in you workplaces. And I encourage you all just too make really rough graphics and explain them to one another. Thank you.
Further Reference
Data Poets’ Society notes. Inaugural gathering, 18 August, 2015.