I guess I’m going to start out sort of motivating some of this. And when we talk about performance and productivity, companies are so data-driven—probably a lot of your companies are so data-driven—when it comes to customers. And I could ask you questions about where your customers buy products, or what sort of products they buy. And you could give me very detailed answers.
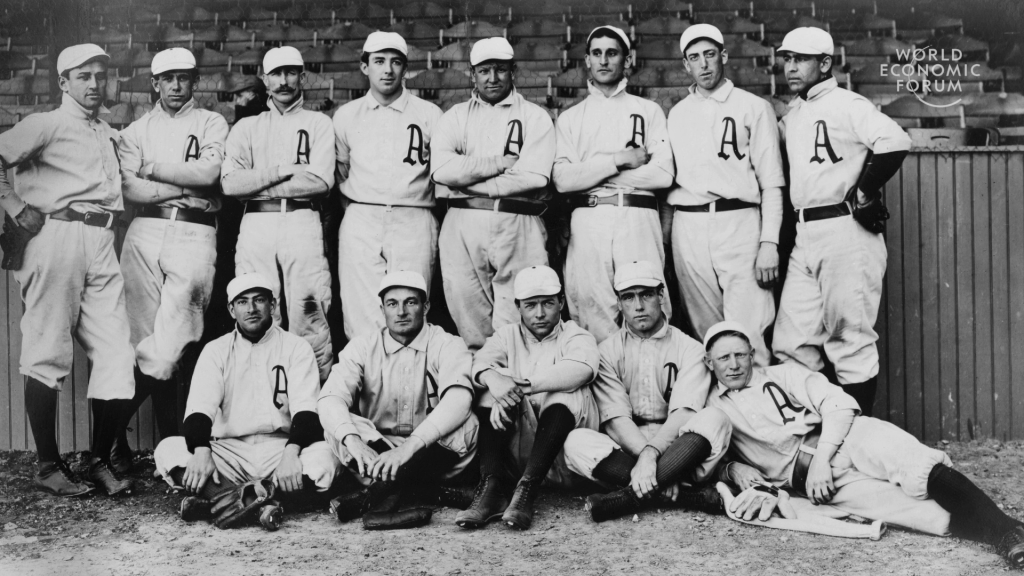
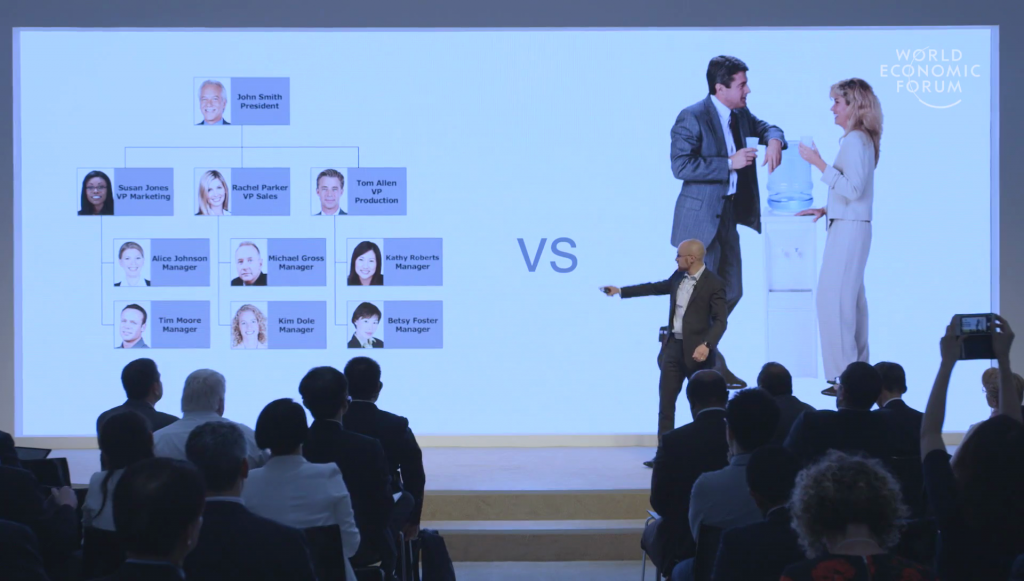
But I could ask relatively similar questions about what goes on within your company that you can’t answer. So, if you’re an engineering company, how much does management actually talk to the developers? If you’re a retailer, how much should you talk to a customer at a store? Now, you think about how basic, how fundamental those questions are. And one of the reasons that we can’t actually answer those questions is because we don’t have very good data about what actually goes on internally. And in fact, there’s really only one industry in the world that is totally data-driven about the way its people behave at work, and uses that data to make decisions. And those organizations are baseball teams.

Photo: Philadelphia American League Base Ball Team via Library of Congress
For 150 years the way you built a baseball team is you had a bunch of old guys who knew a lot about baseball watch people play baseball, and then based on their subjective evaluations they’d build a team. Now, sometimes they’re right, sometimes they’re wrong…that was viewed as the best way to do things. And I’ll point out for those of you who are not familiar with the game of baseball, it’s a game where you hit a ball with a stick, and it’s a game that’s a lot more fun to watch if you’re drunk. So, here we go.
What’s fascinating is this very subjective way of managing these teams continued into 2001. And then one day you get this guy Billy Beane (or Brad Pitt, if you like) who said, “No, we’re going to use behavioral data to build our organization. We can use data about what people do on the field—” and everyone thought he was crazy. But if you saw the movie Moneyball, if you read the book, they went on a record winning streak, they made the playoffs. An now every single organization builds their team in this way.
The question is what is the equivalent of that in industry? Because of this I’ll put up one question here which might seem a little strange. “Why is organizational change hard?” The thing is you know, things like M&A, restructuring, we know they’re hard. But we fail a lot at those things. I mean, M&A fails conservatively about 60% of time.

And a big reason is because we focus on the stuff that’s easy to capture. We focus on the stuff over there, the formal stuff. Because it’s easy to understand. I can point to the person at the top and I can say that’s the most important person in the company.
On the other hand if I ask you, again, how much does management talk to a division? If I ask you who’s the social center of a company, that’s much harder to answer. Because we use surveys or consultants, which are useful for certain purposes but can’t give us the same granularity daily, even monthly, about what’s actually going on. But now because we have sensors, we’re wearing next-generation ID badges, we have digital data, email, IM, phone calls, all of a sudden we can understand at a millisecond level what is actually going on with a company. And then we can use that to first, actually understand what happens, but also understand what actually drives the outcomes we care about.
And this kind of data gives rise to this whole area of people analytics. And I’ll have the standard plug for my book, which it makes a great gift. You can go buy multiple copies. But the idea behind people analytics is really using behavioral data to understand what’s going on and changing the way your company is managed. I’m happy to say that now there are well over a hundred companies that have people analytics divisions. What they do is they take the lessons we’ve learned about analyzing customer data and applied it internally.
I want to give you a flavor of what that actually can look like. So, one of the things that we do is we use sensors, sort of next-generation ID badges, to measure how people talk to each other, using a microphone. Who talks to who. And where people spend time, and how they move around. We don’t record what people say. We don’t give individual data to companies. And I know we’re going to talk later about some of the privacy implications of this kind of technology. But what I want to show you is data from a major European bank.
What we did is we deployed these sensors across actually hundreds of locations. These are retail locations, where have people selling loans to customers. And they have some locations where they really outperform the projections that the company made, and they have other locations that really don’t do such a good job. From a formal perspective, they’re exactly the same. People are trained in the same way. You have similar employee demographics. Just very different performance.
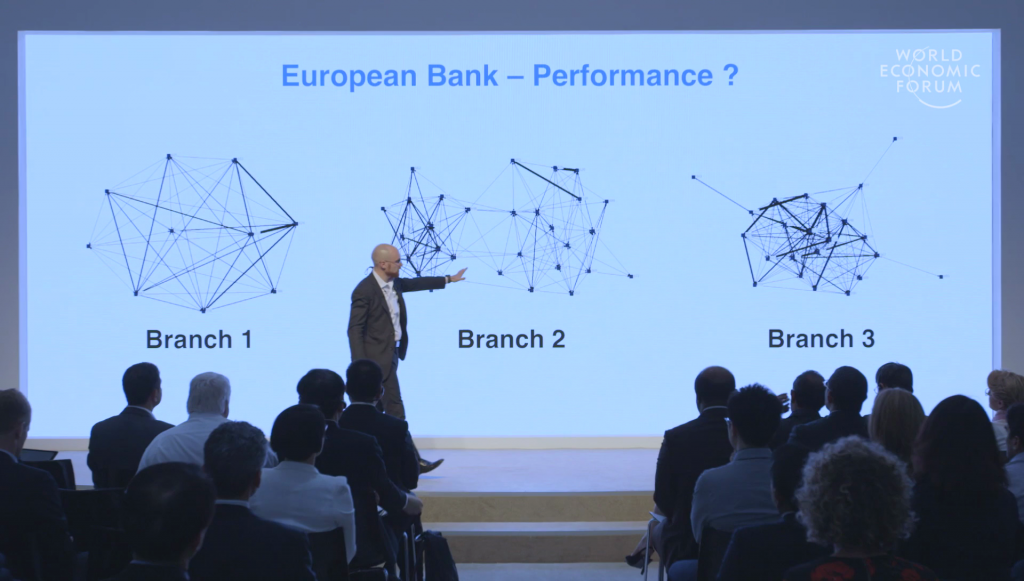
So what do they do differently? I’m going to show you data from three branches. I added some noise to the data so it’s not actually the original data. But it gives you a flavor for what you can see. And I’ll show you just a very simple cut of the data.
Wee see three branches here. Each dot represents a person. The lines between them represent how much they talk to each other face to face, which we can detect with these devices. So we see something very interesting. There’s a number of branches like Branch 1, where pretty much everybody talks to everybody else. We see branches like Branch 2, where we have these two clusters here, which is sort of interesting. And then you’ve got branches like Branch 3, where you’ve got a really tight knit core, but you’ve got three lonely people on the outside.
And so the question is which branch has the highest performance? They look very different. We found hundreds of branches that cluster into these different areas. So we’re going to have a little vote here. These people all have the same job; they’re selling small business loans. And I can measure their performance very concretely: how many loans did they sell per person? Alright, so who thinks Branch One had the highest performance per person? Alright. Branch 2? And Branch 3.
Okay, pretty close. You guys did pretty well. So, Branch 1 did have the highest performance. And to give you a sense of the order of magnitude of that effect, Branch 1, the average employee there would sell about 250% times the number of loans as someone in a branch like this, like Branch 2.
Now, Branch 3 was also quite close, but these outliers brought everyone’s performance down. So what’s happening? Why does this happen? Well, now we’ve identified that there are behavioral differences in these different kinds of branches. So we can actually start to zoom in, and the bank sent people to see what do they do differently. People are paid based on how much you sell. But it turned out that at branches like Branch 1, managers had implemented an informal bonus system. They had a target for the whole branch, and if you hit it everybody got a bonus. They incentivized people to share, and they do.
Branches like Branch 2, we saw lots of them like this. Exactly two groups, and every time it was two groups. Any hypotheses about why that would be? First floor, second floor. We timed it. It takes less than ten seconds to walk from one floor to another. But nobody does it. And it had a huge effect. You save money on rent, you lose it in performance.
Branches like Branch 3, any guesses for these outliers, who they are? Work from home? Not quite. Bosses. I wish; no. These are new employees. But they’d all been in the branch for over a month, and they still only talk to their manager. Actually, they only talk their manager.
Now, what they did is they ran tests. Took this group performance system, rolled it to out to half of their branches. They started switching people’s desks, first floor and second floor, in two-floor locations. And now they give €100 a week to managers to take their new employee out to lunch with somebody else. We can get into the details later. Long story short, with controls, that increased sales by over 11%. This is worth over €1 billion a year. Using relatively simple changes.
And so the future of this technology, a lot of people think of Star Trek or Star Wars, and I like to think about something a little different. I like to think about Harry Potter. If you remember the Harry Potter movie, they have these stairways that move on their own; I always really liked that idea. And imagine with this kind of data coming in all the time that you can get into an elevator, and you don’t press any buttons but you get offered a certain floor, an algorithm lets you off there. Because you’re probably going to have an interesting conversation there.
Imagine the coffee machines move around at night; they’re robots, and actually do that to change the interaction patterns in an office. And literally one of our customers does that, so I actually have data from this. Groups in the Netherlands are making robotic walls. And eventually, of course it’s going to apply to really big businesses. But it could eventually apply to small business as well, where you could understand what makes my restaurant effective, and how can I compare that to the best restaurant in the world? Or what could I learn from a grocery store in Africa?
And then how could I not just learn from those companies, but big companies learn from small companies? Companies in Russia learn from companies in the US. And really rather than waiting a decade for an HBR case study to come out, being able to do this literally in a matter of days. So really that’s the potential. And I appreciate everyone for listening. Thank you very much.
Further Reference
Annual Meeting of the New Champions 2016 at the World Economic Forum site

