I’ve learned so much already this couple of days days at PopTech, and already some of the things that I’m learning are offering me a little bit of clarity. For example, Moran Cerf yesterday told us that there are actually two voices in our brains that are helping us to make decisions. In this case, I have me on the stage standing here right now, and then I have the me that decided that this slide would be a good way to start off the presentation.
Big data? I think all of us have probably seen presentations already about big data. Big data in business, big data in science, big data in pizza delivery. Whatever those things are. But I think one of the things that we haven’t heard very much about is what is the subjective experience like of living in this world of big data? What is it like to be us living in this ever more complicated world?
ARVE Error: The Vimeo endpoint located at http://vimeo.com/api/oembed.json?url=http%3A//vimeo.com/91515815 returned a 404 error.
Details: Not Found
https://vimeo.com/91515815
I do a lot of traveling, and and so maybe this is an example with some bias, but I think if we imagine the experience of being in an airport, we might start to understand this data experience. First of all because there are a lot of systems that are transparent to us that are happening around us. Our baggage is moving on carousels. There are security agents who are herding us through line-ups, and so on and so on and so on.
Second of all, there’s a loss of control there. I think it’s one of the only places that we voluntarily give up control in our lives, in an airport. We’re put into line-ups. We’re kind of directed. We’re put on to these planes in these kind of data packets that are then sorted into another airport and offloaded, and so on and so on and so on.
Maybe more importantly, though, is this idea that we’re part of a system that we can’t possibly imagine the magnitude of. Right now, as we speak, there are more than a million people in the air. The graphic that you see behind us is this respiring system of airplanes landing and taking off at fifteen-minute intervals. There are thousands of airplanes in the air right now. So I really think that that this idea of being caught in a system which is very complicated, and too complicated for us to understand really mirrors this experience of big data.
The American novelist David Foster Wallace was very president about this. He was asked by his editor when he was writing Infinite Jest about why he put so many footnotes in the book. The footnotes in that book are really incredible. Sometimes the footnotes have footnotes, and occasionally those footnotes have footnotes, as well. And he said that one of the things he wanted to do was to mimic the information flood and data triage that he expected to be an even bigger part of life fifteen years hence. Infinite Jest was written sixteen years ago.
I’ve been really excited about this idea of big data since I had a conversation about three years ago with this man, László Barabási. We were working on a project for Wired magazine in the UK, where I was the editor of that somewhat unfortunately-named section called Infoporn. I worked with doctor Barabási on a project to help show some of the results from a project that he was working on about human mobility. And we had the really good luck of working with this data set which is one of the largest data sets of cell phone usage from an unnamed European country. The country has a name, I’m just not allowed to tell you what it is. And so the first thing we see is this graph, which is not a very exciting graph.
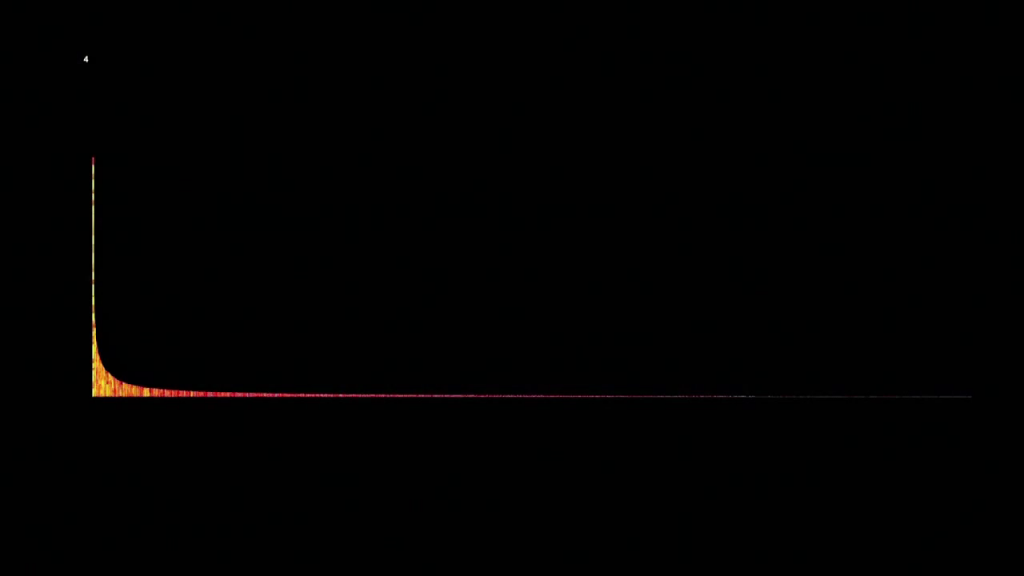
What this is, is this is a segment of about fifty thousand of those people, and as the graph gets taller on the left, those people talk a lot on their phones. And as it gets shorter on the right, they don’t talk very much at all. And the people on the left, they talk eighty-four hours a week on their phone, and the people on the right are not really talking at all.
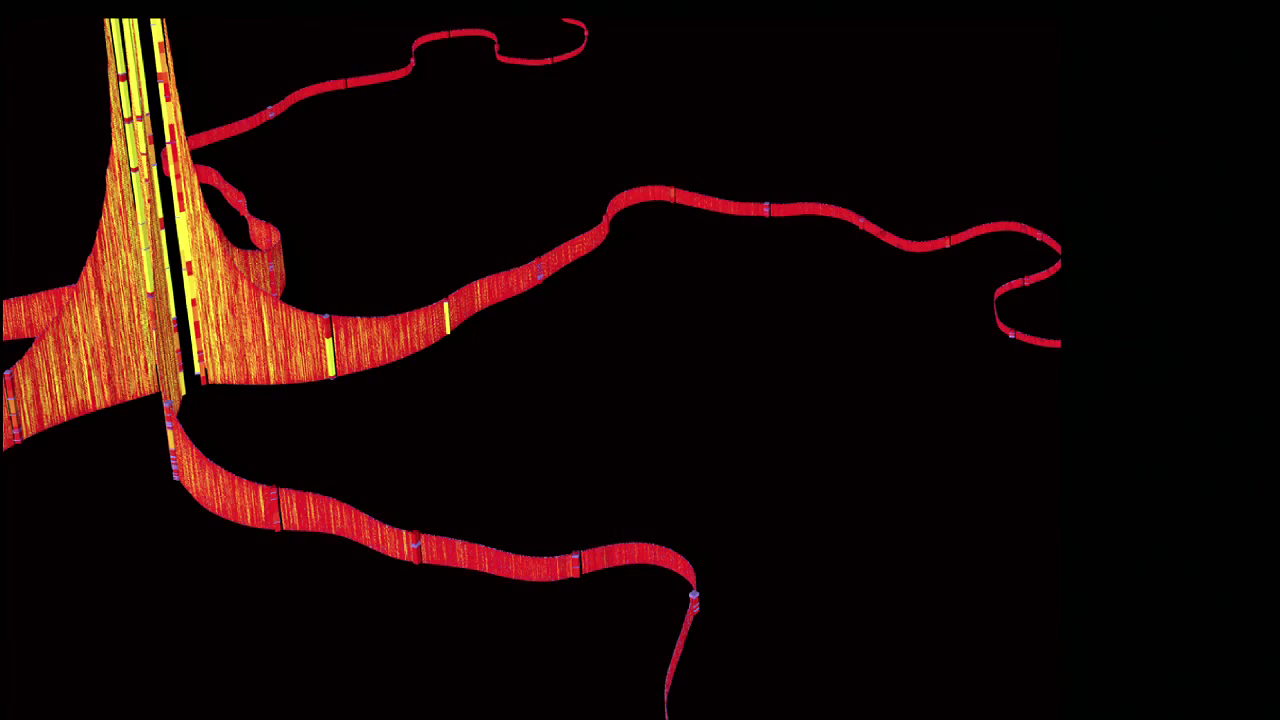
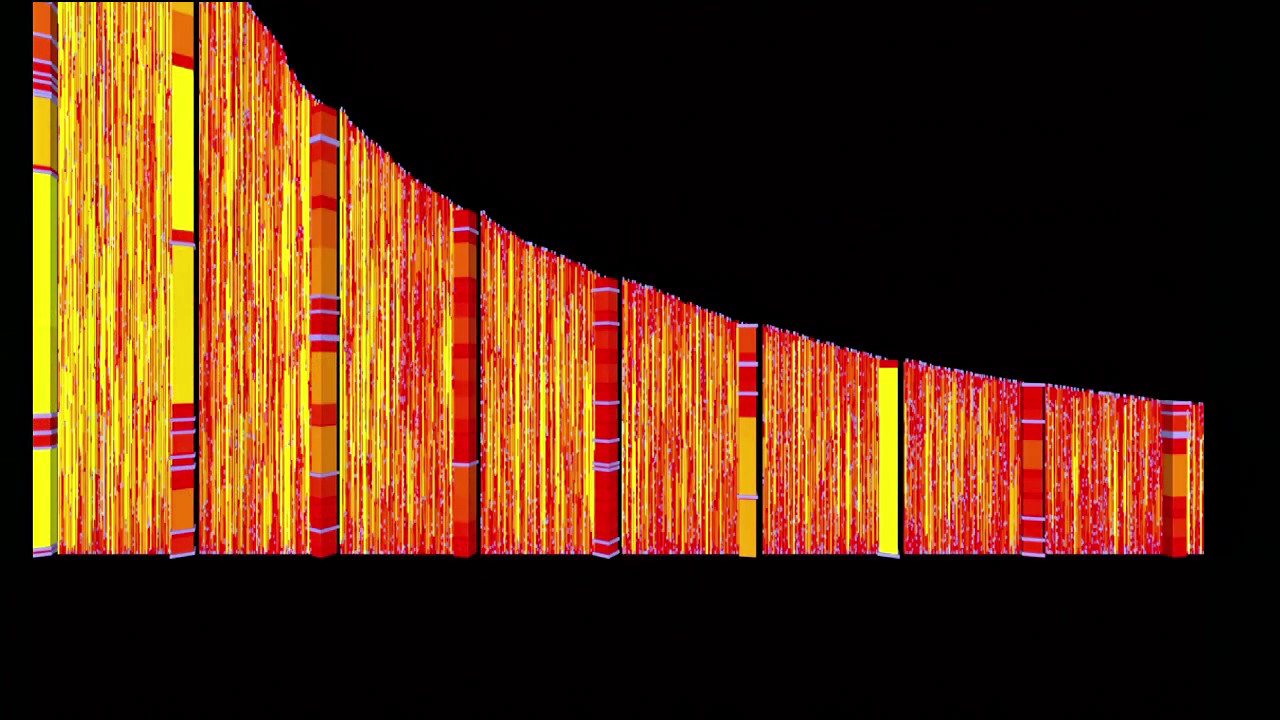
So, on the left-hand side of this graphic, I took a whole bunch of these sections and stacked them up so that we could just see the richness of this data. There’s a lot of data, and for each person in that data set, we were able to see their calling history over time, piece it together, see exactly how they were calling and who they were calling.
But maybe more interestingly is the thing that happened on the other side of the page, for which I built these little cubes which I call mobility maps.
And so what we’re seeing here is we’re seeing a cube that shows a single person’s travel over about four days. This person is clearly a commuter. They travel back and forth from one location to another. But in that data set, we were able to produce these mobility maps for everybody in that data set. Tens of thousands, hundreds of thousands of people, and see how their lives can be represented in this really simple form. And one of the things that surprised me and that surprised the Barabási group was that there was a lot of predictiveness in this data. And so I started getting this idea that we could look at the data trails we were leaving behind, and we could start to construct things from them. So the next few projects that I worked on carried through that idea.
ARVE Error: The Vimeo endpoint located at http://vimeo.com/api/oembed.json?url=http%3A//vimeo.com/4587178 returned a 404 error.
Details: Not Found
https://vimeo.com/4587178
This is a project called Just Landed. How many of you are on Twitter? Probably most people are on Twitter. So, you’ve read those tweets, that somebody says, “I just landed in Hawaii. We’re stuck on the runway for twenty minutes. This is really irritating.” These rich white people tragedy quotes, right. So I thought it would be really interesting to take those kind of really self-serving things, these thinly-veiled show-offs and put them together into a map. Maybe we could recreate human mobility system by seeing how people are showing off about their travel around the world.
https://vimeo.com/6239027
Maybe a little at a little less meanly, I also put together this project, called called GoodMorning!, which looks at everybody saying “good morning” to each other on Twitter. So, here’s everybody in the world in 2009, so more than three years ago, all saying “good morning.” The green people are getting up early and saying good morning, the orange people a little bit later, and the red people really late. When we look at the United States, you really see the red on the West Coast and the green on the East Coast.
And I’ve been carrying these ideas throughout my work ever since then. At the time we built this project, working together with a statistician named Mark Hansen and with the rest of the really talented team at the R&D group at the Times, we built this project called Cascade. And what cascade does is it looks at conversations about Times content on Twitter. And we’re able to recreate every single conversation that happened about every piece of Times content, in real-time.
So, we’re looking at a story which is a couple of years old here, but it’s an interesting one for a couple of reasons. Just to explain what we’re seeing, on the left-hand side is the very birth of this conversation. And then now we’re about twenty-four hours into the conversation. As degrees of separation get above, we’re going from one person to the other, who tweets to the other person, who tweets to the other person.
But really what we see is we see the architecture of discussion. We see something that we’ve never seen before. So exciting. This was one of my favorite projects to work on. I felt like an archaeologist, exposing things for the first time that we’ve never seen before.
But, something always set really uneasily with me about this project and with the other work that I showed you, and that is that largely this work depends on opportunism. We’re dependent on taking people’s data without telling them about it. And even though Twitter is overtly public, that I don’t think makes me feel a lot better.
I was speaking at a conference a couple of years ago, and somebody said this for the first time, I think the first time that I heard it: data is the new oil. And people…they clapped. They were excited about data being the new oil. I think they were thinking about this, right?
Whereas I was thinking about this, but in the context of this:
We didn’t do very well with oil. And to suggest the data can be the new oil I find frankly terrifying. But maybe there is a piece of this analogy that works for us, because oil is composed of all these tiny microorganisms, these prehistoric microorganisms that have been compressed into this sort of valuable resource.
Data consists of fragments of our lives. The valuable data that we’re talking about content consists of fragments of our lives that are being compressed into this valuable resource. Now, maybe it’s the Canadian in me, but I’m not sure that I trust corporations to take charge of this type of resource. And I’m really interested in how we can do a better job with data than we did with oil.
Do you want to stop different transmitted diseases?
Do you want to design better cities? Do you want to stop traffic jams?
The data to do so is there in private hands, and we need to identify some social consensus by which the data can be shared with the different stakeholders who can take advantage of that.
edge.org, “Thinking in Network Terms, A Conversation with Albert-László Barabási”
So, László Barabási, who we mentioned before, in an interview last month had some really interesting things to say about data and its value to us. He says if we want to do all these great things with data, we have to come to a social consensus, because this data is valuable and it’s owned by all of us collectively. So how do we come to a social consensus to make sure that that data can be used for good and not necessarily only for profit. Well, three things, I think.
Data ownership. We have to get people used to the idea of owning their own data. It is your data, you should own that data, and that’s not the way it works right now. So, at the Times, we put together this project called Open Paths [blprnt.com blog post] which allows you to store your location data securely and share it, if you wish, with resources. It’s the “if you wish” that’s important there with with researchers. So you can share this if you’d like to. So please download the app, start recording your location data. It’s really fun to explore. And then share that data, if you wish.
The second thing that we need to really be talking about his date and ethics, because I think ethics have been very, almost all, lacking from this conversation. And it’s really important that as consumers of data services we start to make decisions based on ethics.
And then finally let’s get back to the first thing that I talked about, which is this subjective experience of living in a data world. I’m really really really convinced that the only way we can reach this consensus that we’re talking about is by sharing with people and exposing to people what is happening in this data world. And that’s I think where the role of data art comes in.
I come here today because I’m excited about data but also because I’m terrified. I’m terrified that we are having progress without culture in the world of data. And as we’ve seen with these failed industries before, progress without culture does not work. And there’s a lot of powerful people in this room, and if I can leave you with one thing, let’s try to bring culture into our discussion with data. And let’s try to not make the same mistakes with this new resource that we have with the last ones.
Thank you.
Further Reference
This presentation at the PopTech site.