Golan Levin: I’m thrilled to introduce Luis Morales Navarro. He’s a graduate student in the Learning Sciences and Technologies program at the University of Pennsylvania, and a contributor to p5.js. His background is in middle school computer science, open source software development, and physical computing. He’s interested in issues of access, inclusion, and motivation in learning to code, and the role communities play in the development of computational fluency. Luis Morales Navarro.
Luis Morales Navarro: Thank you Golan. Let me get my slides on screen and start. There we go.
Hello! Thank you Golan, again. I’m very grateful that I got the opportunity to participate in this program and learn so much from all of you. I do not describe myself as an artist, so this residency was a great opportunity to engage with artists and other folks that are working on what I prefer to call open source software tools for creative expression and creative computing. If anyone is interested in downloading the slide deck that I’m going to be using, I posted a link on the chat, and it has screen reader-accessible alt text descriptions for images.
I am very interested in how people learn to code. And for some people when they’re learning to code, it is a very exciting opportunity where [indistinct] are challenges that have to be solved and puzzles to discover new things and try new things. But for others it can be a very frustrating experience, especially when learners are not supported by the tools that they’re using, by their peers, their teachers, or by the communities around them.
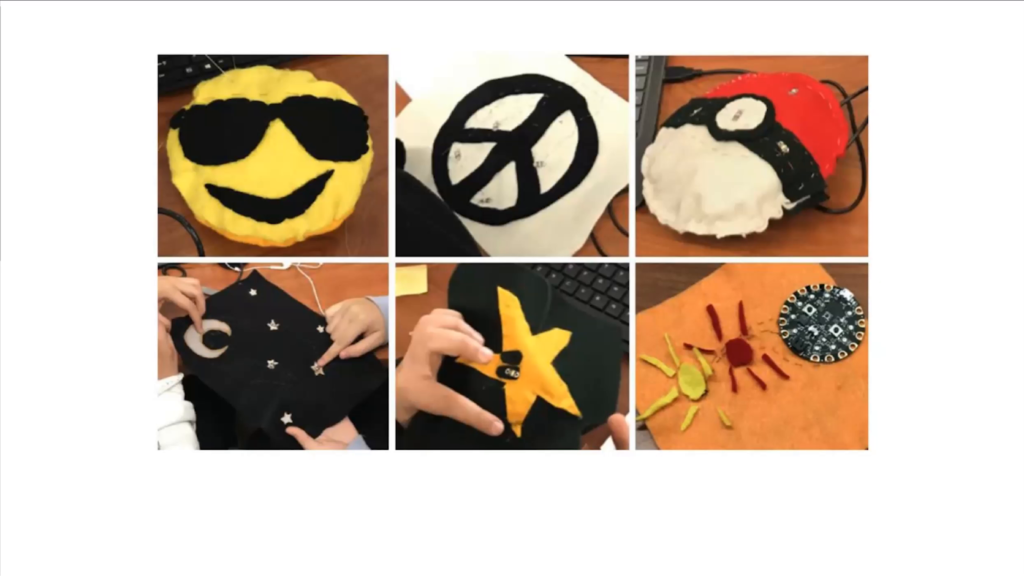
I’m not an artist, but I spend most of my time studying and researching how novices learn to code, considering the cognitive, the sociocultural, the emotional and motivational factors of learning. But also thinking about how we can improve the experience of learning to code and make it more engaging for novices, and youth in particular, as they make personally-relevant creative computing projects.
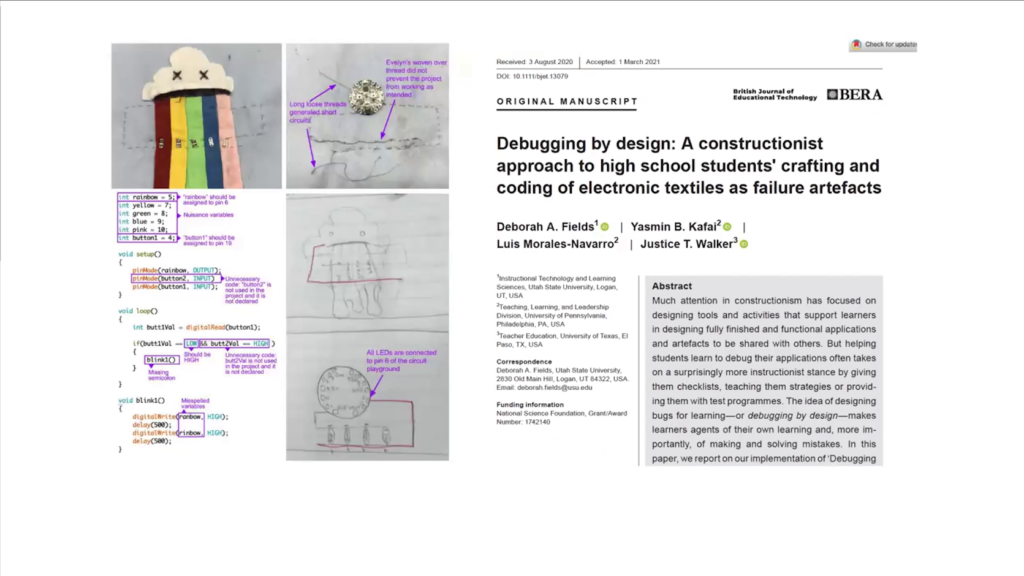
Debugging by Design: A Constructionist Approach to High School Students’ Crafting and Coding of Electronic Textiles as Failure Artifacts
At Penn, I’m currently working with a team researching how youth design and solve bugs in physical computing projects. And although this is a topic I can talk about for quite some time, today I’m going to talk about something else.
I’m going to talk about p5.js and web accessibility, and particularly about creating infrastructure for accessibility in an open source creative coding community. So, is p5.js accessible to people who are blind and visually impaired. That’s a question that a lot of people ask. And the quick answer is no. Very few sketches are. Yet, we have been working towards making p5.js more accessible to people who are blind over the past five years. And this is what I’m going to talk about today, about the work that we have done and how it has evolved over time towards a community-centered approach, and also towards creating infrastructure that can support better accessibility features in the future.
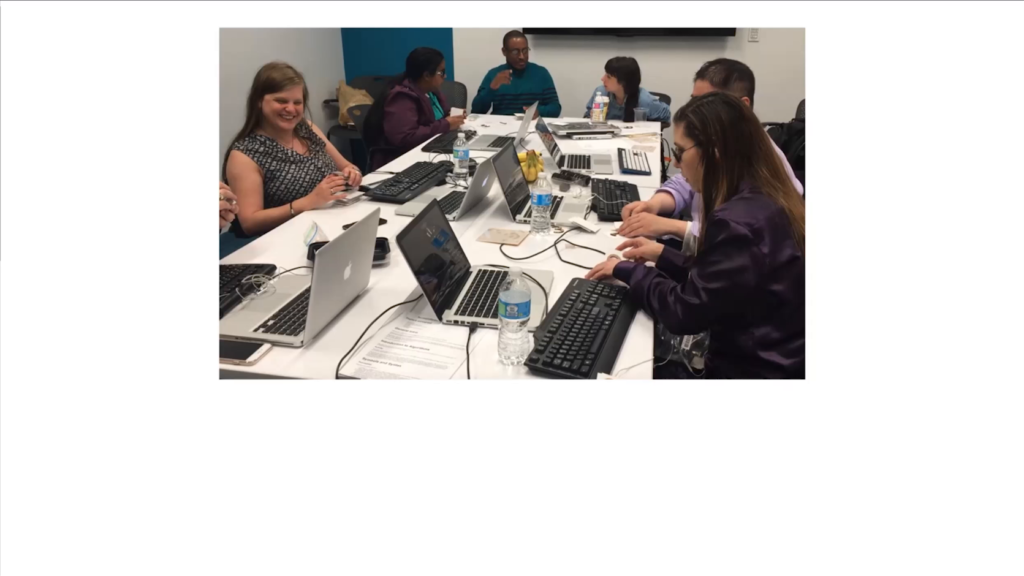
It all started in 2016, when Chancey Fleet, a blind technology instructor at the New York Public Library’s Talking Book Library, she wanted to create a diagram for a banquet. And she reached out to Claire Kearney-Volpe and they started looking for tools to make the diagram. Chancey is blind, and they found that most of the tools out there were not accessible to people who were blind. Claire reached out to the Processing Foundation and the folks that were developing p5.js. And they started working together to improve the accessibility of p5.js sketches. In the picture we actually can see Chancey sitting over here, and here is Claire Kearney-Volpe.
So to give you a little bit of context, people who are blind navigate computing technologies using screen readers, which are software that read out loud what is displayed on the screen. But to do this the content displayed on the screen has to follow certain accessibility guidelines, so that the screen reader can access it. For example screen readers recognize images but can not describe them. We need to add alternative text or image descriptions for screen readers to communicate the meaning of what an image says.
So Claire started working on adding alt text to the reference examples of the p5.js web site. And actually, simple web content that is well-written is very accessible to screen readers. But the canvas element which is at the core p5.js is the most inaccessible web element, because it is a bitmap. A screen reader only knows that there’s a canvas element, but it cannot tell what shapes are being drawn and what is going on inside of the canvas. And because it’s a canvas element and not an image element, the alt text feature for images doesn’t really work for the canvas.
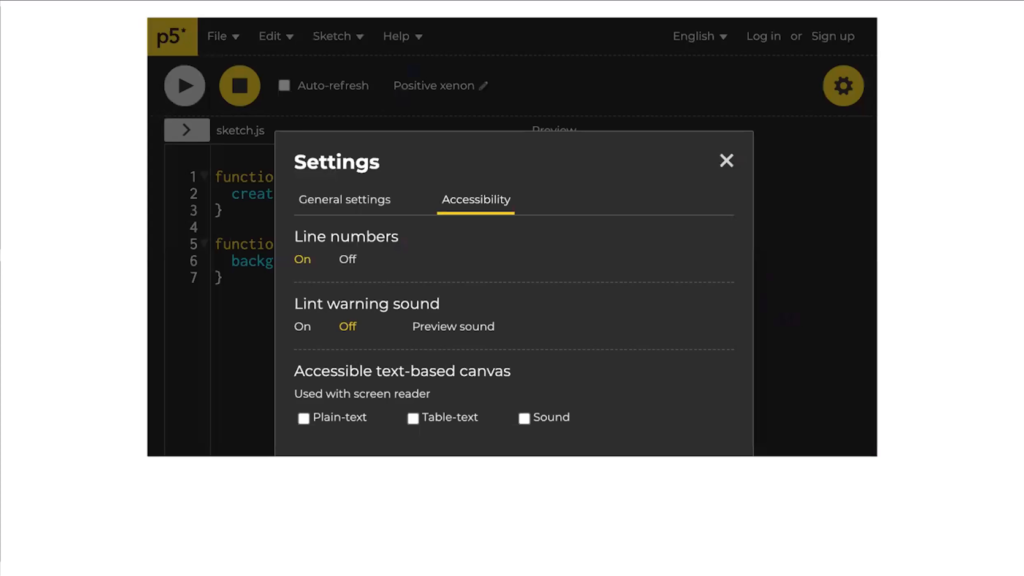
I met Claire in late 2016, when Scott Fitzgerald who is listening to this talk introduced us. And they were working with Mathura Govindarajan to add accessibility features to the p5.js editor that Cassie was starting to work on. I joined them, and together with the support of a dedicated group of contributors and advisors—Cassie, Lauren McCarthy, Josh Mielle, Sina Bahram, and Chancey fleet—we implanted three accessible canvas outputs—a text output, a grid output, and a sound output—that sonified the movement of shapes. So if a shape moved up and down, the pitch of the sound would change, and then if it moved left or right the sound would pan. And all that was work that we did in the alpha editor, so the very early p5.js web editor.
At the time, Claire, Mathura, and I were all working at NYU, and that was very helpful because this project became part of NYU’s Ability Lab and it was something that we could do during our day job. We tested and improved the outputs. Claire was teaching a class on accessible tech at NYU. And that was also great. Because we could do user testing and involve students in the process of developing these outputs.
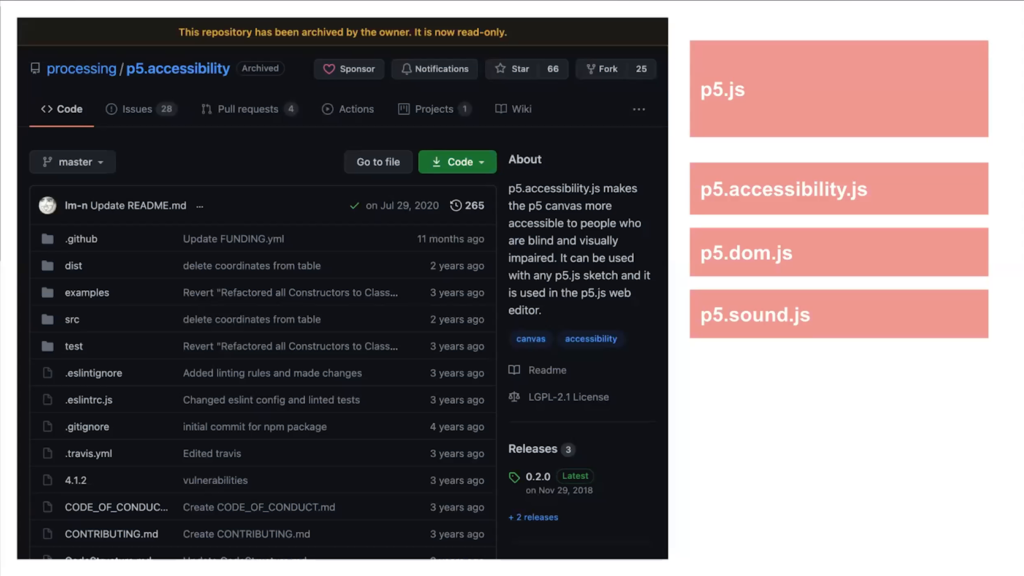
Our efforts were limited to the editor. And we started thinking, how could we use screen reader-accessible outputs outside of the editor? Mathura and I got a Processing Foundation fellowship with Clair as our mentor to further develop the outputs into an addon that could be used to make any p5 sketch on the Web accessible. This addon could be included into the HTML of any p5 project and make the outputs accessible. So for this, what it was doing was kind of reading from the sketch of p5 and interpreting that to create a meaningful description of what was going on in the canvas. We call this kind of monkey patching because there was no real connection between the p5.js library and what the addon did. And for that we got a lot of help from NYU students— Antonio Guimaraes, Elizabeth G. Betts, Mithru Vigneshwara… And we actually got our first contributor who was someone who we didn’t know when were we working in this. Yossi Spira just showed up and started contributing with code, and that was a wonderful thing that happened. And we created this library that is called p5.accessibility.js. As you can see, it has been archived. And I’m going to talk more about why it has been archived in a few minutes.
By the time we finished the fellowship that helped us create p5.accessibility.js, none of us worked at NYU anymore. And we couldn’t dedicate as much time to work on this and to work on p5 accessibility. So the project kind of died out for a little bit.
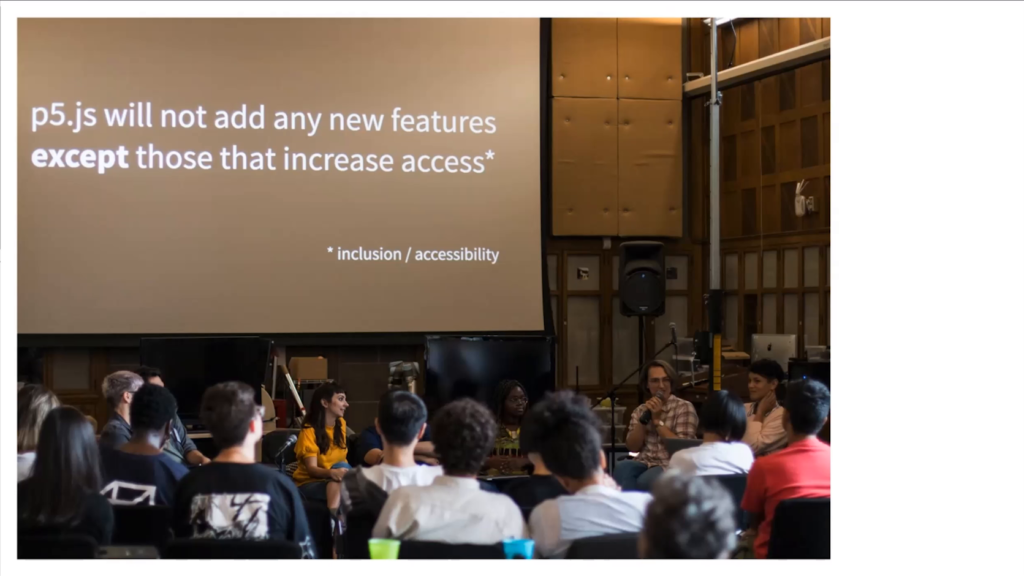
Until 2019, when some of us went to the p5.js Contributors Conference at the STUDIO for Creative Inquiry at Carnegie Mellon. And that was a really important moment. Because as a community as Cassie described, we came together and we reflected on what access meant for our community and on what the priorities were for p5.js. I’m showing an image again, and I’m pretty sure you’re going to see it for a third time today in a few minutes in evelyn’s presentation. At the 2019 p5.js Contributors Conference, we reinforced our commitment to access and inclusion. And together with Claire, Sina Bahram, Lauren, Kate Hollenback who is here too, Olivia McKayla Ross, and evelyn, we outlined a pathway forward. Which in terms of web accessibility meant a couple of short-term actions.
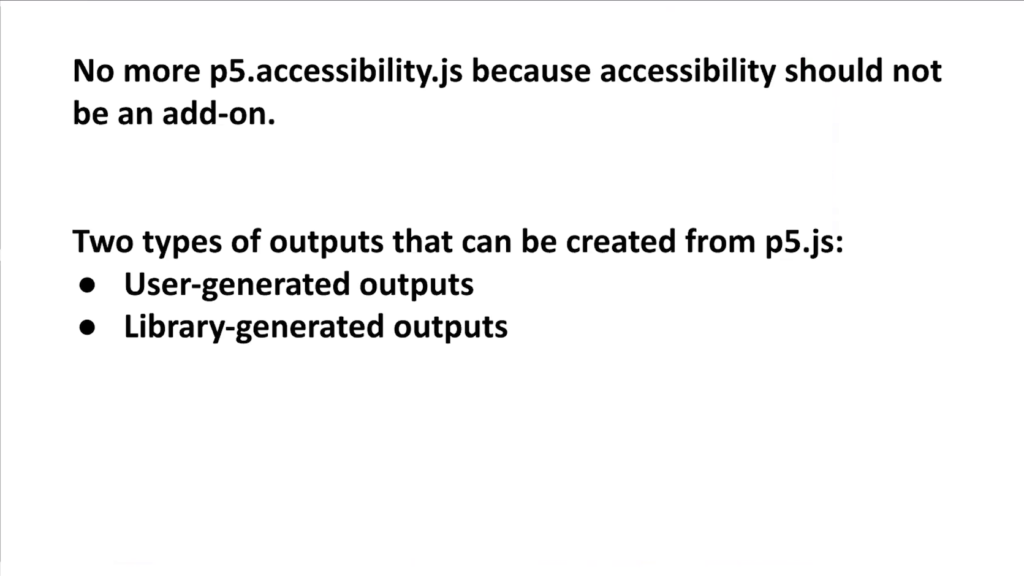
First we identified the need for functions that allow users to write their own descriptions. And second the importance of merging the addon into the p5.js library. So we did not want to continue working on p5.accessibility.js, because accessibility should not be an addon but something that is part of the core library of p5.js.
And this idea of two types of outputs, that kind of was the beginning of redeveloping what accessibility looks like in p5.js. Having functions for user-generated outputs and functions for library-generated outputs.
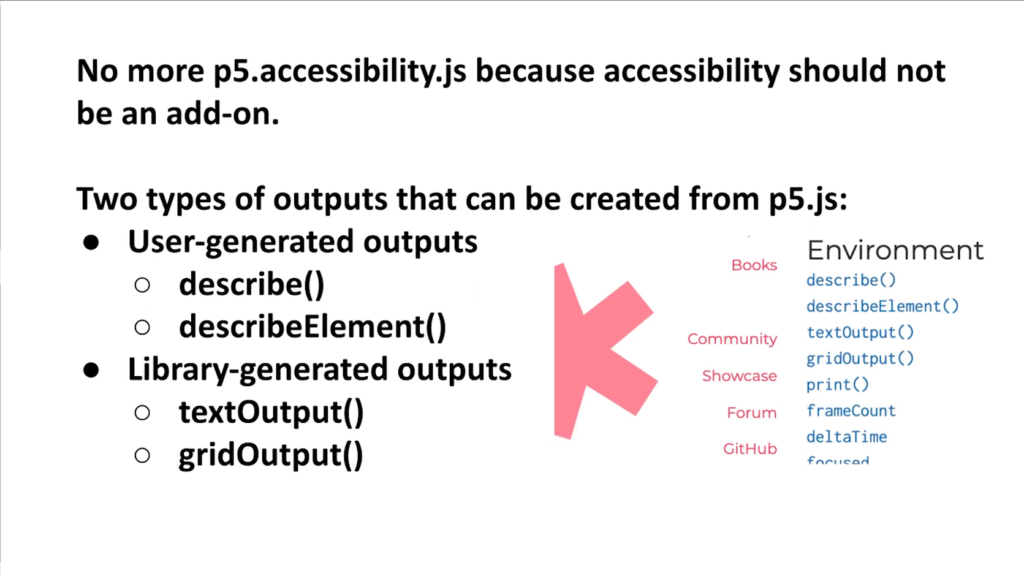
I worked on this with Kate Hollenbach partly supported by Google Summer of Code last year. And we worked on four different functions. For user-generated outputs we created describe(), that allows people to create a short description of what their sketch is doing and what’s going on on the canvas; describeElement(), that helps people create short descriptions of elements or groups of shapes that when they come together they create meaning also on the canvas.
And then library-generated outputs. A textOutput(), a text description of what’s going on on the canvas. And a gridOutput(). All these functions that are making this possible are distributed throughout the p5.js library. And that is really exciting. Because you can find them in many files that have nothing to do with accessibility. You will find things that have to do with web accessibility. And then if you mess up something somewhere else, it’s going to mess it up in another place.
And we decided to do that so that it’s fully integrated, but we also decided to put it in the reference in the section called “Environment.” Because we wanted accessibility to be a core part of the environment of learning to code within p5.js
And I think what I’m going to do now is actually show you… Yes! I’m going show you what it looks like, so I’m going to stop sharing my screen and share my screen in one second.
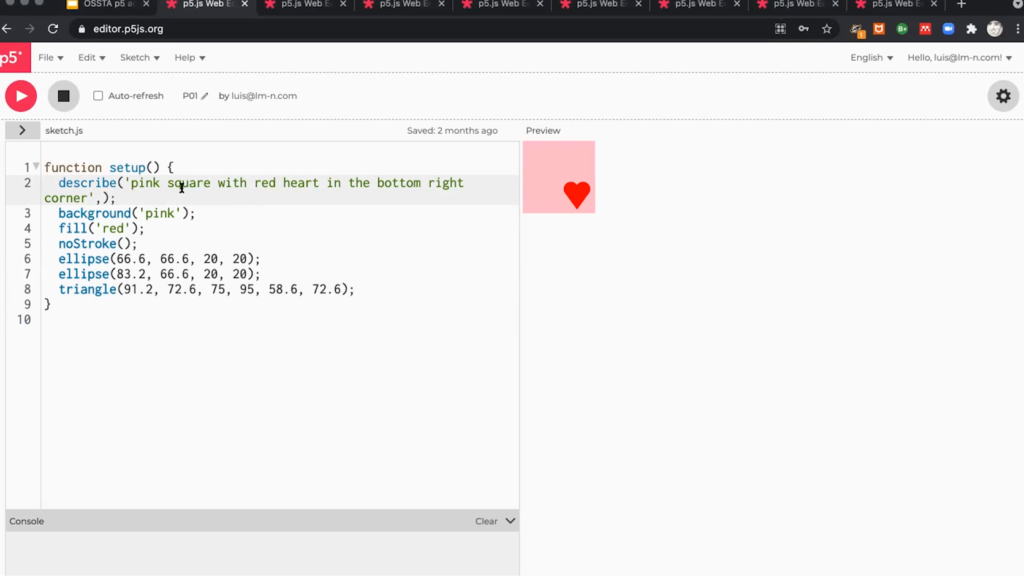
So I’m going to start by showing you an example. So this is an example of a sketch using describe(). There you can see what we are doing here is just writing a little description of what the sketch does. And I’m gonna play the sketch. And there you can see it. It’s a pink square with a red heart in the bottom right corner. And this is what a screen reader, what the assistive technology that people who are blind would get out of this sketch: [A machine-generated female voice reads out, “Pink square with red heart in the bottom right corner. You are currently on the text element.”]
So in a very simple way, any programmer can just write a short description inside of the function describe(), putting the description between quotation marks.
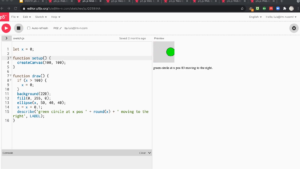
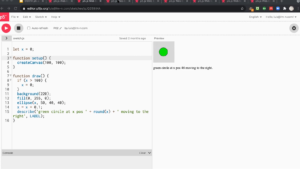
Let me show you another example of describe(). In this case I’m also displaying the description on the canvas on the HTML. And you can see how the description is also changing. So the value of the ellipse that we’re drawing here is being shown, too. And I’m gonna play again. This is what a screen reader would get out of this canvas: A machine-generated female voice reads out, “Canvas description: region: green circle at x pos 5 moving to the right. Canvas description: green circle at x pos 49 moving to the right. You are current— Canvas description: region: green circle at x pos 79 moving to the right.”
And that gives you an idea. So there what I was doing is I was accessing the canvas several times, and every time I would access it it would give me a different description because the ellipse is moving and the description is changing. So it’s kind of a dynamic description. And again, this is created by using describe(), a very simple function.
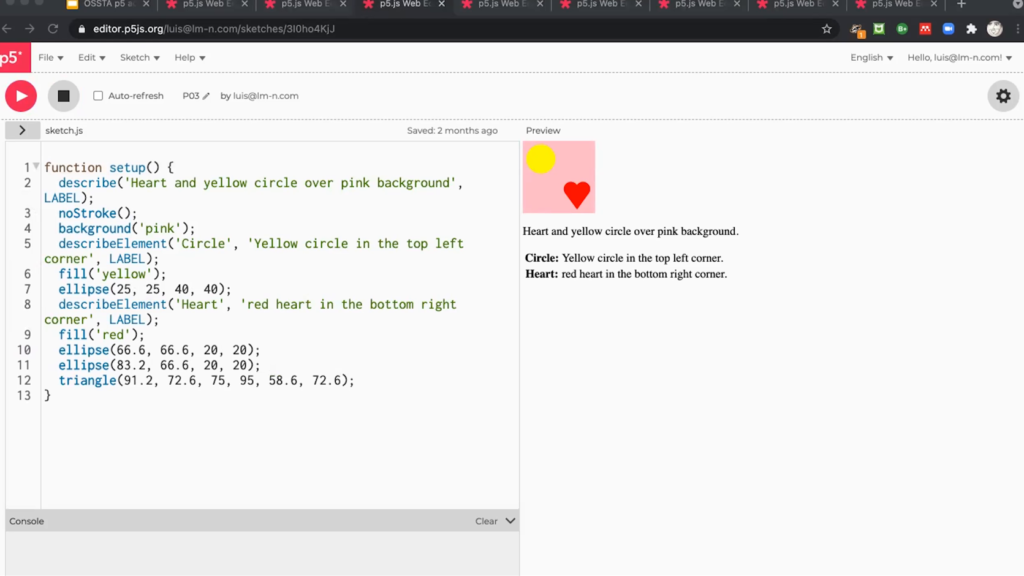
Here is another example of using describe() elements. Here we’re using describe() to describe the whole canvas and then describeElement() to describe little elements inside of the canvas, in this case a heart and a circle. And also instead of reading it or telling you about it, I’m gonna play— A machine-generated female voice reads out, “You are currently on a tex— Canvas: heart and yellow circle over pink background. Canvas elements and their descriptions: circle. You are— Yellow circle in the top left corner. Heart. You are currently on the— Red heart in the bottom right corner. End of canvas description.”
So that gives you an idea of how this can be helpful so that people can describe the canvas as a whole but then also the little things that are happening there.
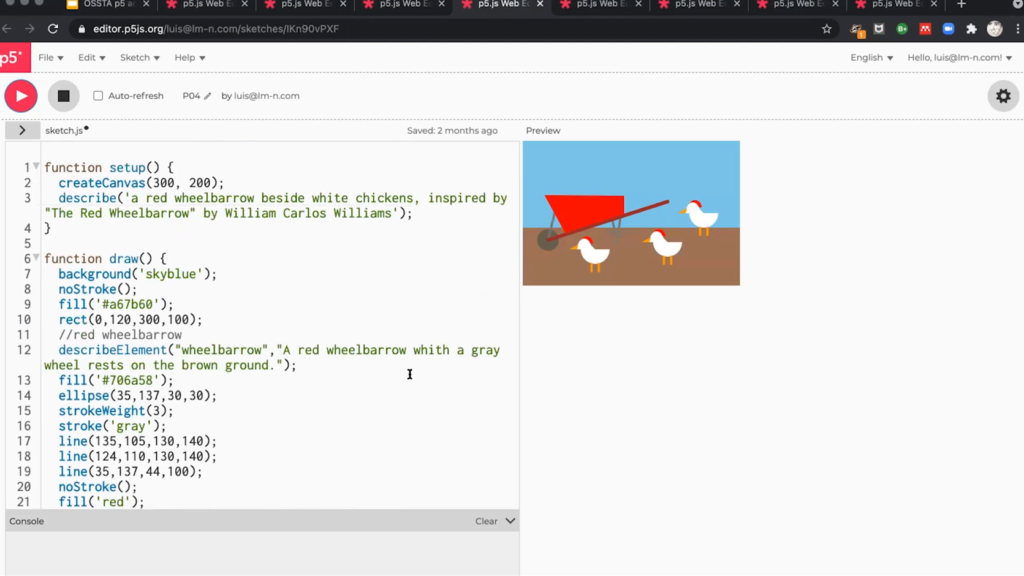
And here’s a sketch that is a little bit more complex. So in this one we have all these things happening at the same time. And what is great about it is that we can describe the thing as a whole but then go into the little elements and say a little bit about them. So this is what the screen reader would get out of this description that I wrote in this sketch. A machine-generated female voice reads out, “Main canvas description: region: a red wheelbarrow beside white chickens, inspired by ‘The Red Wheelbarrow’ by William Carlos Williams.” Canvas elements and their descriptions: wheelbarrow: A red wheelbarrow with a gray wheel rests on the brown ground. Chicken 1: a white chicken in front of the wheelbarrow. Chicken 2: a white chicken to the right of the wheelbarrow. Chicken 3: a white chicken standing between Chicken 1 and Chicken 2. End of canvas description.”
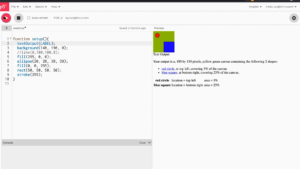
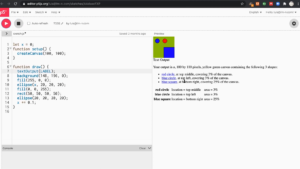
So it gives you an idea of how screen readers read the contents of these functions. And for the other two functions I’m not gonna play the screen reader. I’m just gonna show you what it looks like. So this is text output. Again, this is a library-generated output that has a general description of what the canvas has, then the content of the canvas with a little bit more detail. And then a table with the shapes. And what is exciting about this is that if the elements on the canvas are changing—and again right now support is limited so we’re only supporting basic shapes. But infrastructure is there so that this can be expanded. If the shapes on the canvas are moving, the descriptions are also moving. So you can see it said “top middle” and now it says “top right.” So the description is dynamic. And it’s being generated as the ellipse is being generated in the draw() loop. So that’s really exciting because the description and the ellipse are being created at the same time.
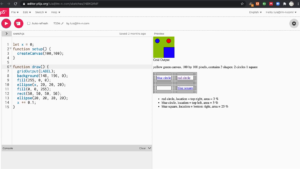
And let me show you now the table output. So table outputs are cool, ’cause they kind of create a table where the elements are mapped. So it creates a table that is ten by ten, and then depending on the position of the elements on the canvas, that’ll be the position of the elements on the table or on the grid. So here you can see how the red circle is kind of moving inside of the table as it is moving on the canvas. Very exciting and this is useful because screen reader users can actually kind of get an idea of spatial distribution between the shapes on the canvas.
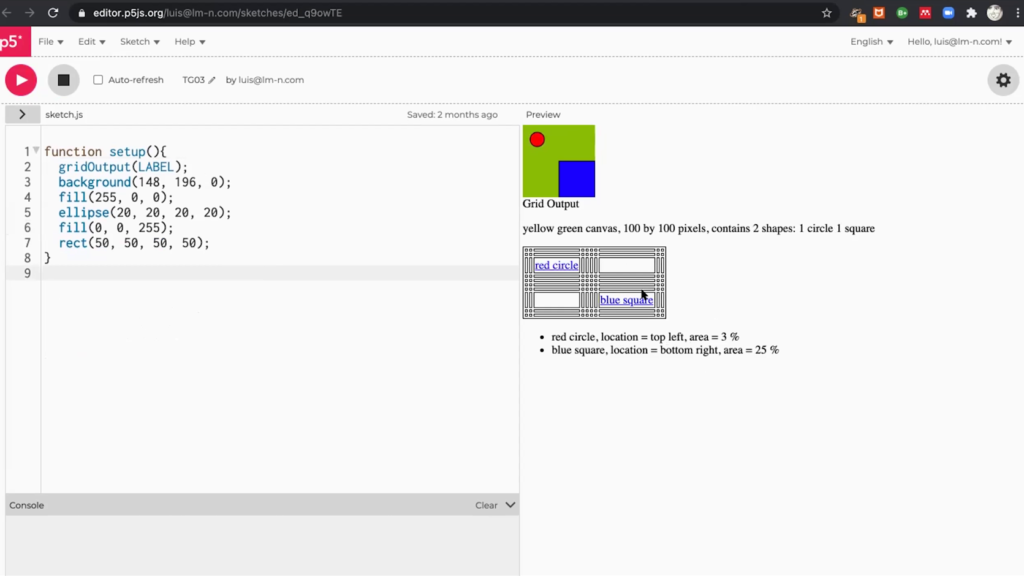
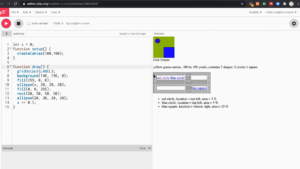
And I’ll show you this one where nothing is changing but again it just gives you an idea of how things are distributed spatially on the canvas.
So yeah, we decided to integrate the accessibility features into the canvas and to create these user-generated outputs. And we’ve been working on it for a while. It’s been fun. The functions that make this possible are distributed across more than twenty-six files in the p5.js source. And that’s also exciting because people that are working on something that has nothing to do with accessibility have to encounter lines of code that deal with accessibility, and then that involves the community in thinking about it.
And that’s actually what I want to talk more about. And accessibility’s not really a task for the few. It is and it should be a community endeavor. And a couple of folks earlier talked about “#noCodeSnobs” as a p5.js kind of mantra. And that’s definitely part of this project, but also #noAccessibilitySnobs. So, trying to think about accessibility as something that anyone and everyone can engage with, and something that should be easy. And as a community responsibility where because we care about each other we want to make our work, our projects, more accessible to more people.
So I think that accessibility features should be accessible. That’s the first thing. They should be accessible to screen reader users, of course. They should be accessible to contributors. And they should be accessible to people who use p5.js. In the Web Content Accessibility Guidelines there is a principle that is called “understandable.” And that is that information must be understandable. So it’s not enough to say look, this exists and here is the information. But it should be up presented in a way that the person that needs the information can understand it. And I think that that’s really important for the community. It is real important for us to think about accessibility in a way that we can convince contributors, even contributors that are not working on things related to accessibility, to consider accessibility as they work. But also so that we can convince people who are making sketches in a classroom, or sketches for fun, to also consider the accessibility in their sketches. So that’s kind of what I’m thinking a lot about these days, is how do we make these efforts about accessibility understandable to more and more people.
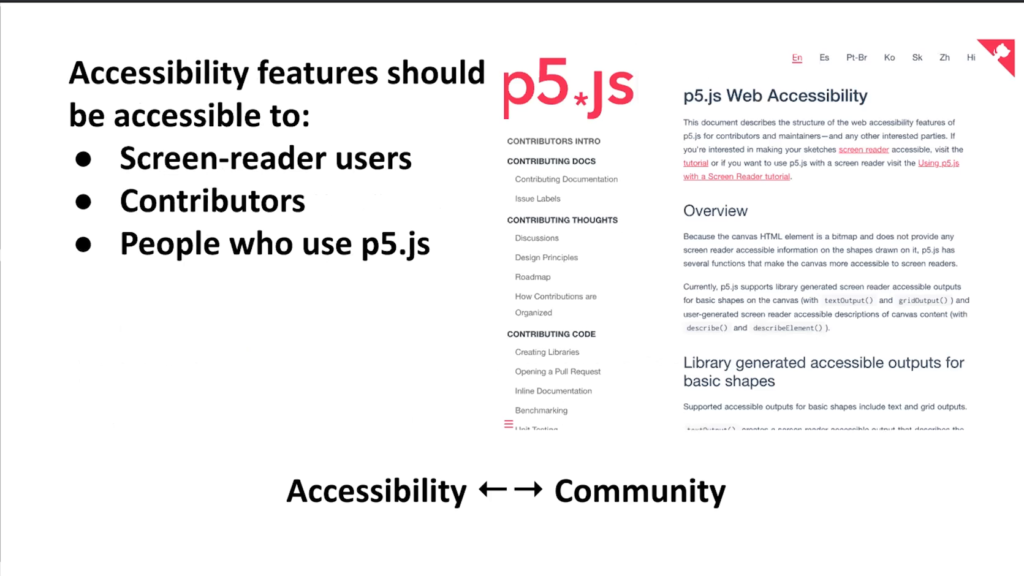
And at the same time, make them more accessible. To screen reader users of course, because we want them to be able to understand the content that the p5.js community is creating. To contributors, so that they have to think about accessibility whenever they make a change to the library even if it’s not related to accessibility. And actually during OSSTA residency something very funny happened and something that made me really happy happened. And it’s the WebGL features of p5.js were broken for about two weeks, and we were getting all these messages on GitHub of people saying like [in a mocking voice], “WebGL is not working, help us.”
And the reason why it wasn’t working was because of accessibility. Some little bug in one of our accessibility functions that declared global variables was breaking WebGL. And for me that was a huge accomplishment. Because that meant that accessibility was fully integrated into the library and there was a consideration that we as the p5.js community had to take whenever thinking about the library as a whole and not an isolated thing that only a few people care about.
As part of this work done on web accessibility, contributor docs. So again documenting what is happening, where, and why is it happening there. I also think that accessibility should be accessible to everyone. To people like any of us, and people that are learning to code, especially novices. And that’s why we created these describe() and describeElement() functions to empower users to create their own descriptions.
And a lot of people ask “Why don’t you use image recognition software to create descriptions of what the canvas says, or what the canvas has?” And it is a possibility, and we are thinking about exploring it and it’s definitely down the pipeline of the things that we want to try and explore. But the reality is that the best descriptions of a sketch come from the people that create them. And that’s why when we’re thinking about accessibility, and that’s why I get very excited when I talk about describe() and describeElement(), because it’s a very simple function that any beginner can use to make their sketches a little bit more accessible.
So there’s a lot of work to do. User testing, testing, and testing. That’s something that has to happen. And these little things that I showed you today are not near perfect, and they will probably never be. And I’m very glad that I have the support of Claire Kearney-Volpe. And together with Chancey Fleet, Claire is doing a lot of the testing so that then we can get that feedback and integrate it into how these functions within p5.js work.
We’ve also gotta work on tutorials, improving the reference, and on learning materials. And that’s one of the things that I’ve been trying to tackle during this residency working on the reference.
And we’ve gotta work on accessibility in the editor, and that’s a conversation that we keep having, particularly because CodeMirror is not the most accessible tool and it’s currently used in the editor.
But the most important thing perhaps is that we’ve got to keep going. And we’ve gotta push forward and try different approaches and new things. And another thing that we can do and then you can also do, is you can use describe() and describeElement() in your sketches. And you can use it with your students. And that could be a really cool way of engaging with accessibility as a community effort, an effort of care, and of making our work more accessible to more people.
So, a lot of this work has been possible because of the p5.js community and I just want to say a big thanks to a bunch of people that have contributed through throughout the past five years to the way that we think about accessibility, but also to the testing, and of course to the development of these functions, and of the library that is archived and is not used any longer.
Yeah. Thank you so much. I think that that’s it for now, Golan.
Golan Levin: And I’m back. Hi, Luis. Thank you so much for that wonderful presentation. We have a minute for a question or two, and I thought I’d ask, actually. So, I have to say that the first time I saw the describe() function, I was actually kinda teared up. I was really moved by the way that it made the artworks available to new people, and to people who couldn’t experience them otherwise.
But I wonder if you could talk about… I mean, these functions like describe(), they’re for the audience of the artworks. But I wonder if you could talk about enhancing accessibility for the creators of the artworks, for production not just perception.
Luis Morales Navarro: Yeah. So that’s the reason why we have two sets of functions. The user-generated descriptions, we’re thinking of those as functions that can support consumption or interacting with artwork that already exists. And then we have the library-generated outputs. And those are still…in baby steps. The library-generated outputs currently only support simple shapes, and it is really hard to actually get a meaningful description of what’s happening on the canvas to describe how shapes relate one to another, that’s something that we definitely have to improve. And WebGL is a complete like, new world that we haven’t even started working towards tackling.
But using these three outputs that we used to have—and now we only have two outputs, the table output and the text output, we’ve actually seen novice programmers who are blind create projects and play with color. And again, I’m talking about very few people, because this still has not been tested widely. But I can think about like Antonio Guimaraes, who was a student at NYU ITP creating a very colorful chessboard and being very excited by being able to code something that people could see and then reading or listening to the description of what they were creating.
So that’s a very exciting example that I saw happen. And it’s something that we definitely have to work on. How do we improve the tools for creating? And I think that’s a big part of it is—and it’s a conversation that a lot of folks have been having, is thinking about transitioning from CodeMirror to something that is better in the editor. And that something that is better, we don’t really know what it is. [laughs] That’s a big problem. Because it’s not only about how do you understand the output, but also how do you navigate code in a way that is easy and simple.
