Tega Brain: Hi, everyone. I’m Tega. I’m an artist and environmental engineer. And I call what I do eccentric engineering. So, I do experiments with data and technologies and computers that ask questions of how we design and engineer the systems within which we live.
I’m particularly concerned with how to design from the dystopian position of the Anthropocene. How to make creative work that is simultaneously critical and generative. We’re scrambling to figure out what it means to have moved an enormous amount of carbon from the ground into the atmosphere largely via combustion. And so this talk considers some of my work dealing with environmental data and a changing climate, and hopefully points to some of what is at stake as we collectively face this. What does it mean to have augmented the atmosphere and the ocean’s capacity to absorb heat? And to be rapidly increasing the entropy of those systems?
The term entropy of course has two definitions, one in thermodynamics and one information theory. So to start with the thermodynamic definition, entropy is the randomness of the constituents in a system. In other words, if you heat or increase the temperature of a gas, it increases its entropy, its randomness.
And so what ways can we see this in our shared environmental systems? So first of all, we can look at the biological interfaces that surround us and how they change through time. This is the study of phenology. Phenology’s the timing of recurring biological events such as flowering and migratory patterns in different ecosystems. And it’s of great interest to researchers because it’s showing how the biosphere is changing with climate change. Observing phenology is to observe a complex, rhythmic, and cyclical relationship between temperature and time.
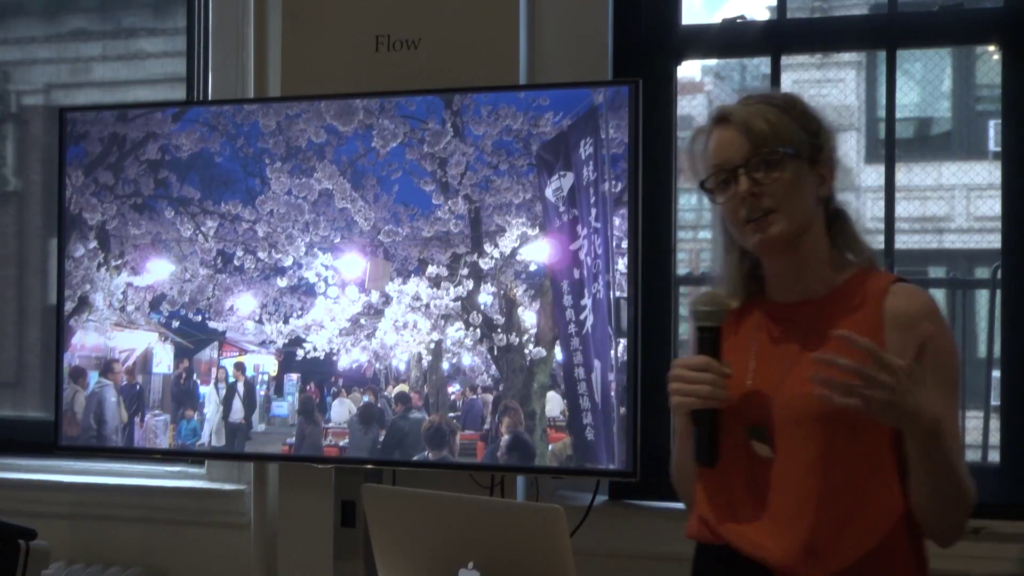
The oldest written biological data set on record is the cherry blossoms bloom in Kyoto, Japan. This is of interest because it heralds the beginning of the cherry blossom festival, and it’s being pieced together since 1800 AD, from the records of emperors ands aristocrats in Japanese history.
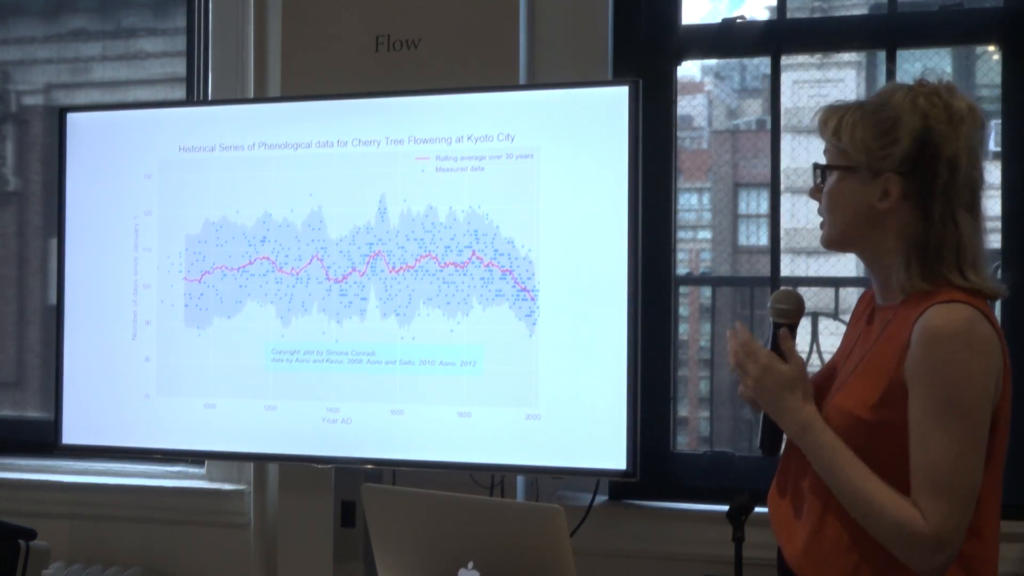
Slide from Simone Conradi, Cherry Tree and Global Warming: to bloom or not to bloom?
This has become an important climate record because the cherry blossom bloom starts after a series of warm days at the beginning of spring. And so it’s very clear from looking at this record that the bloom is becoming sooner and happening sooner and sooner in the year as our system is warming up.
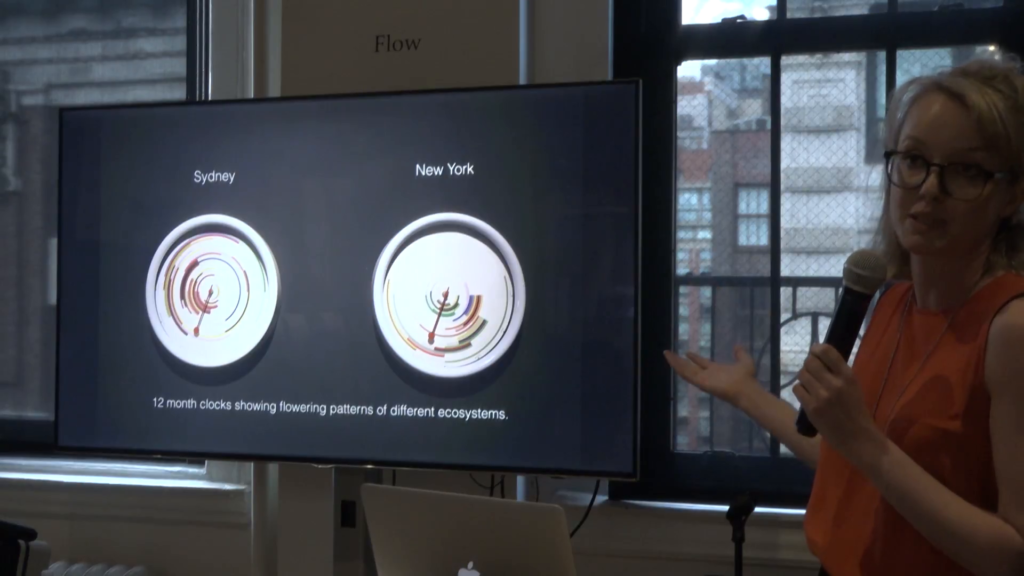
So looking at some of these phenology data sets is at the heart of this project, which was a collaborative project I did at the Environmental Health Clinic at NYU called “The Phenology Clock.” This is visualization software that visualizes phenology data from different ecosystems. And it produces twelve-month clocks. So January’s at the twelve o’clock mark. And each band of color shows a flowering pattern from a particular species of plant. So it shows the duration of that flowering event.
And what is revealed is temporal relationships within the ecosystem. So you can see Sydney on the left, flowers all year round. New York on the right, like nothing happens for six months of the yeah, right? As an Australian I’m horrified by this.
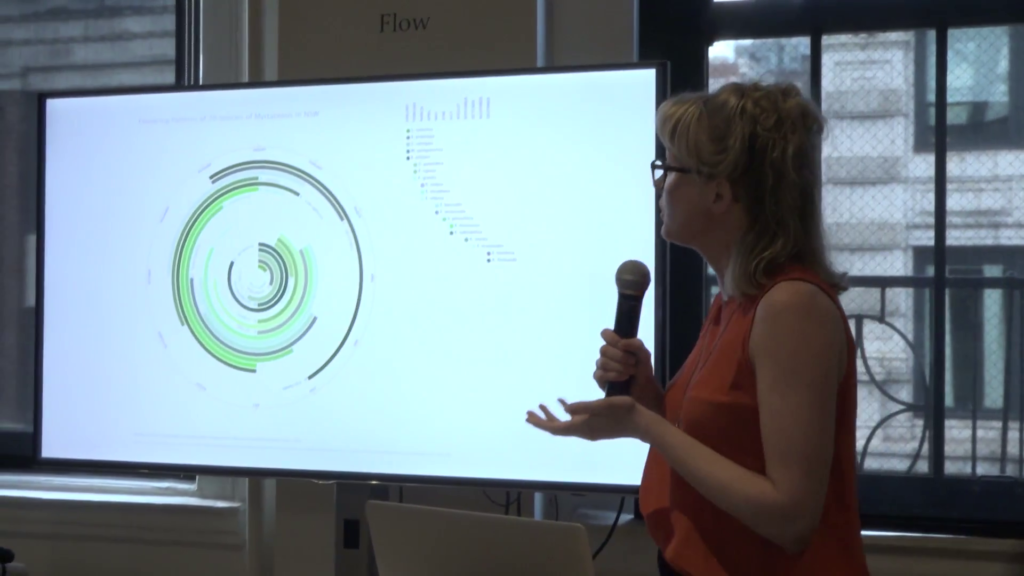
So I’ve used this software to look at a number of phenology data sets from different places, and here is a clock generated from a family of eucalypt trees. And what’s amazing about this image is you’ll notice that there’s always five or six species in flower at any one time. Why would this be? Why would a family of trees distribute themselves temporally throughout the year?
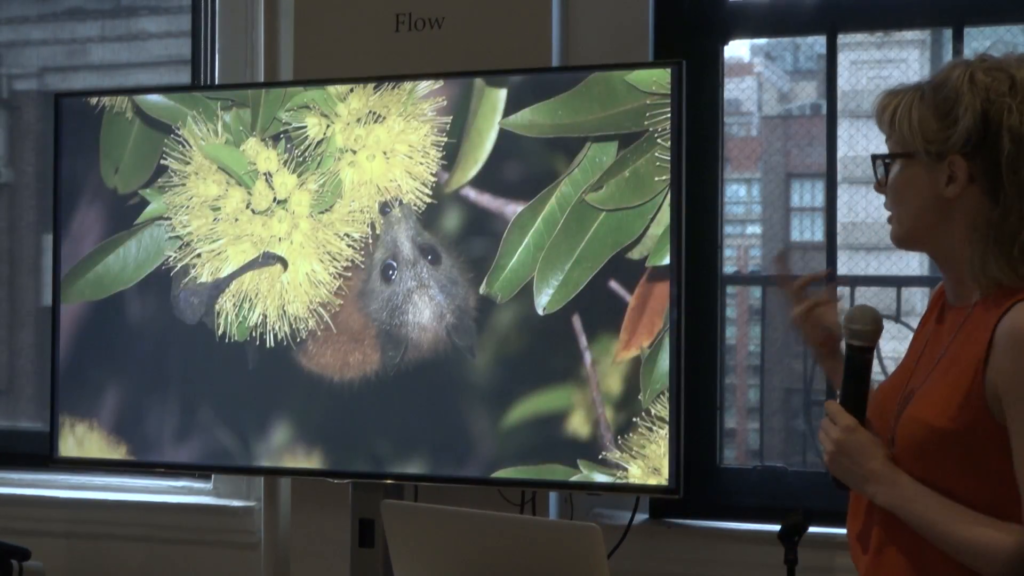
The reason being is it’s thought that they’re coevolved with this species, the flying fox. The flying fox is the dating service for the trees; it pollinates them. And the trees provide a food source. So, by temporally distributing flowering patterns, this guy has a food source throughout the year.
Plants mediate the atmosphere. Increasing entropy flows on to destabilize mutualistic relationships such as these. Increasing overall temperature increases the unpredictability of these species synchronicities.

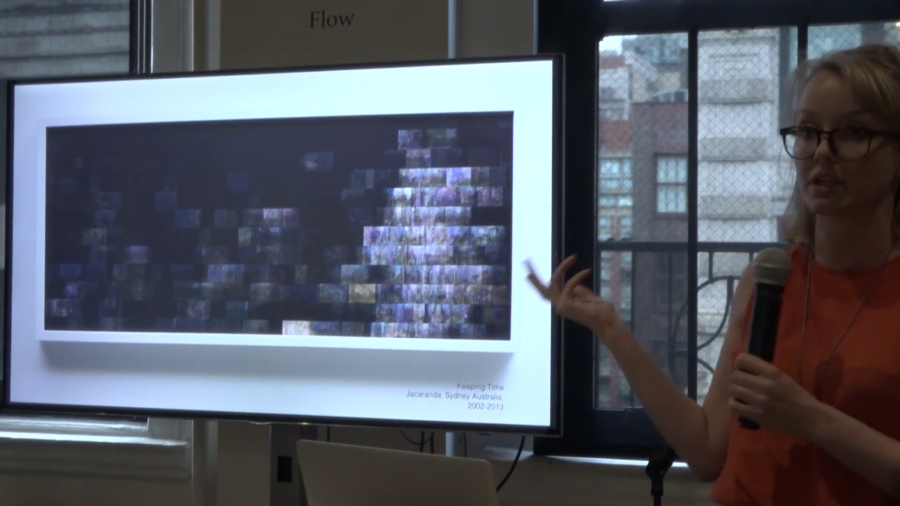
Studies of the Jacaranda, the Cowslip Orchid, the Texan Blue Bonnett and the Sturt’s Desert Pea for the period from 2002–2013. from Keeping Time
A project following this, also exploring phenology was a project I did scraping the Flickr database, looking to see if I could see these patterns in messy, crowdsourced data. The resulting images are made up of thousands of images that are tagged with particular species name and laid out according to timestamp. So January on the left, December on the right, and each band is a year. And here we can see a very clear Southern hemisphere flowering pattern. This is the jacaranda, which is an Australian flower.
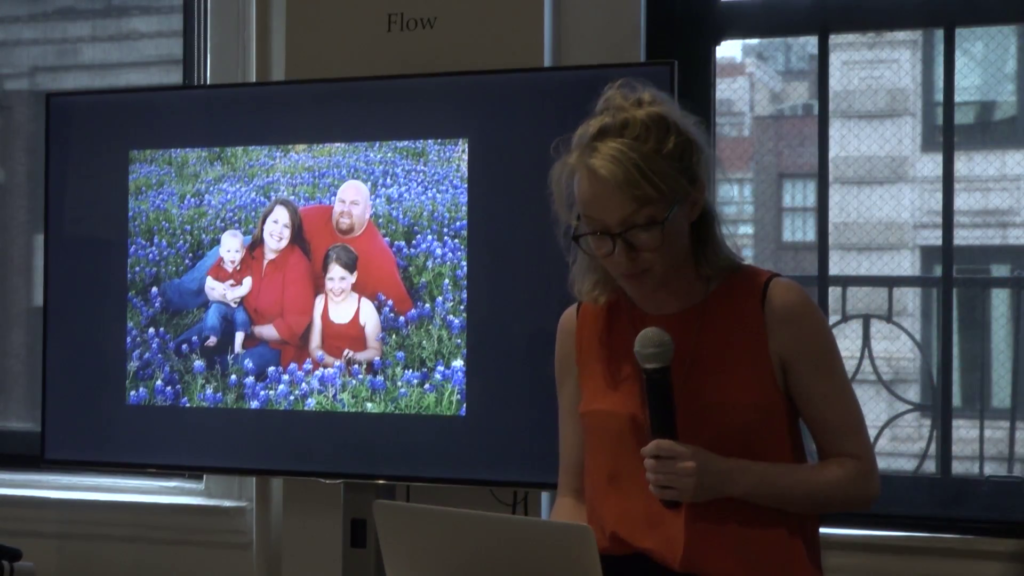
But these images are largely made up of things that look like this, right, a Texan family goes into the field to be photographed with the bluebonnets because you’re not allowed to pick them. So these images actually became… What stood out for me was they were about how we actually relate to these different species, how we see them and how we use a database such as Flickr. They’re as much a result of our social relationships with species as they are indexes of a changing environment.
Environmental observation has of course become increasingly computational. And we no longer rely on direct observation of the biosphere to understand climate. Instead, we use a network of satellites, weather stations, data centers and so forth to do this. We process unthinkable amounts of data, and our computational systems burn up millions of dollars of electricity every month to do this, producing enormous amounts of heat. The transfer of information cannot take place without a certain expenditure of energy, which is what Norbert Wiener said, the father of cybernetics.
Processing data is never thermodynamically neutral. Any active organizing pushes against a tendency for everything to degrade, and cooling has always set the limits on computational design. Computation is about managing heat. It determines how densely components can be packed and where data centers are to be built. If you put them in the Arctic, it really reduces your energy costs.
In other words, cyberspace is hot. Computing is an exothermic reaction. Of course, despite the overdue push to increase the use of renewables, data centers and computers are still run on coal and use [?]. And they use somewhere between 1–3% of our electrical output, and this is rising. Every video, image, Google search we make has an environmental effect. Every computational automation, every machine learning innovation, relies on combustion somewhere. Shouldn’t these costs be considered in how we assess the success or failures of our computational systems? And how might we rethink our network interfaces to make these material costs more tangible?
https://vimeo.com/169271197
These questions are posed by a series of experimental WiFi routers, eccentric WiFi routers that I made in a series called Radiotropisms. This one, called Open Flame is a router that is paired with a candle. To bring up the wireless network, you have to light the candle. When you blow it out, your network disappears. Wax is laid down over time, depending on your online life.
https://vimeo.com/162439283
Each WiFi router also offers a network. Another one in the series, An Orbit, oscillates its signal strength with the orbit of the moon. So for one day a month you get really strong, great Internet, and for one day a month you get none. And it changes over a twenty-eight day period. Again, how might we invite our environmental systems into our networks?
https://vimeo.com/168478266
Finally, this is a WiFi router controlled by a houseplant. And the plan is equipped with a camera. It can take photos of itself and replace images in your network feed. So any unencrypted data ends up with a photo of this plant.
So those are provocations. How can design of our network interface emphasize our ecology rather than hide it behind seamless user interfaces?
So to conclude, I want to return to this term “entropy.” But I want to consider it from the point of view of information theory. In information theory, entropy is a measure of the loss of information content in a signal or a system. A term developed by the father of information theory Claude Shannon to describe the probabilistic measure of uncertainty in a system.
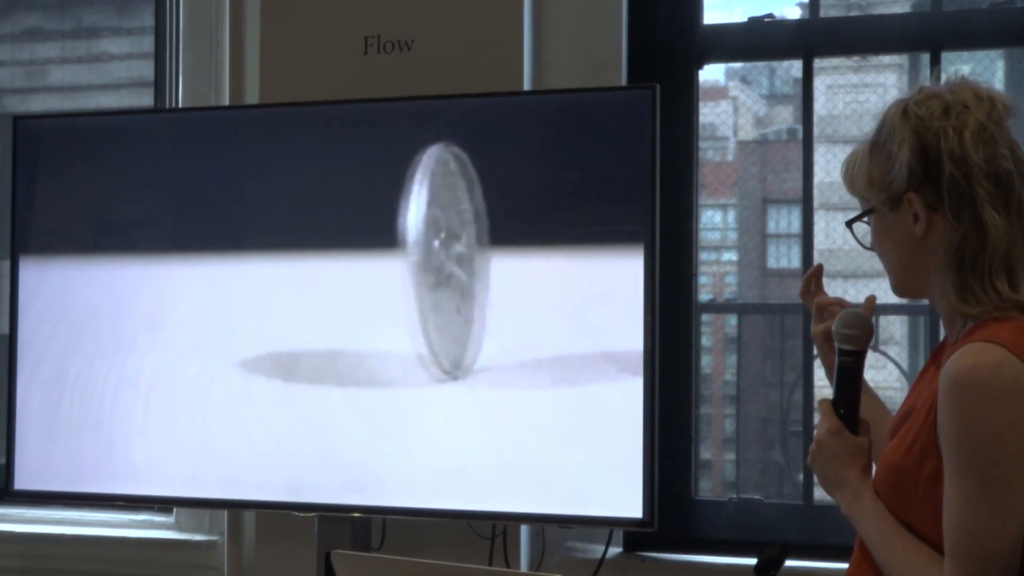
Or to break it down, what does this mean? It’s ambiguous. If we think about the entropy of a coin, we can get either a head or a tail when we toss it, right. This is known as one Shannon of entropy. If the coin was to have two heads on both sides, the entropy of the system is zero because it’s completely predictable what the outcome would be. If the coin was to have three or four or more faces, the amount of information contained in the system is greater, and so the entropy of the system is greater because it’s harder to predict.
The ultimate information science is meteorology, and the project of weather prediction is an ongoing attempt to lower the entropy of our weather system, in an informational sense. We use data to build models to hopefully better predict the behavior of our system. And as historians like Paul Edwards have shown, climate prediction is intimately tied with the development of planetary computation. Computer resources are always inefficient in meteorology, and it is the ultimate big data science. And to me there’s a sort of dark irony that we’ve built sophisticated global systems for collecting Earth and climate observations to predict climate, at the very time where our collective impacts on human society are actively destabilizing it.
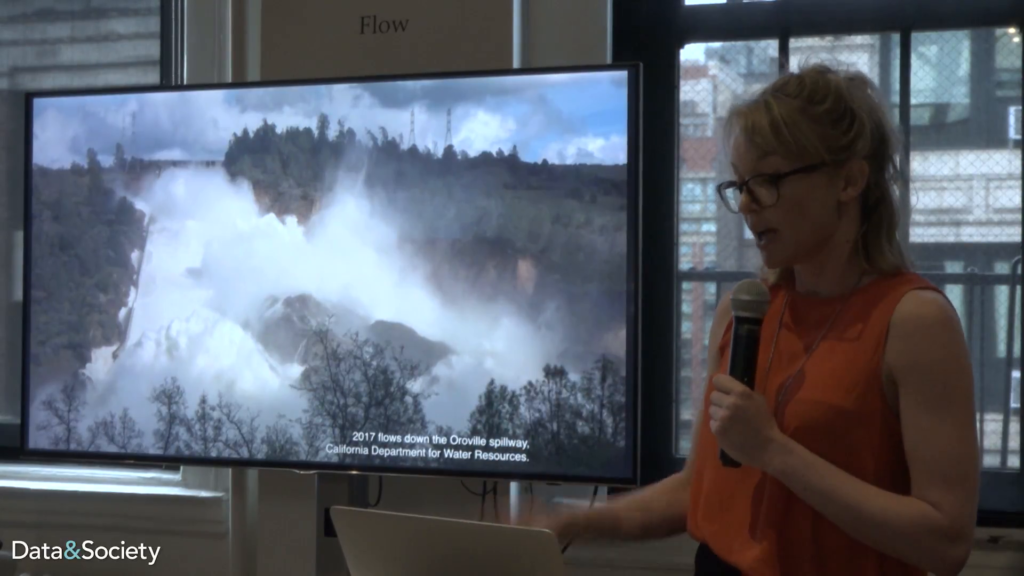
One consequence of this could be observed earlier this year at Oroville Dam in California, when the catchment received more than twice its annual rainfall last winter. As the emergency spillway was engaged for the first time in the forty-nine-year life of the dam, it began to erode, the engineers became concerned, and 200,000 people were evacuated from the watershed with less than an hour’s notice. Although the incident is indeed a failure in adequate engineering and maintenance of that spillway, to call it solely an engineering problem overlooks it also as being a climate problem.
So, a water engineer’s job is to size stuff. The height of a dam, the size of a culvert, the depth of the drain…these things are sized to prevent flooding at certain storm intervals. You generally think about how big your catchment is upstream of the thing you’re designing. You think about what sort of rain patterns are going to happen in that catchment and how frequently it’s okay for it to flood. The best practice guidelines in stormwater modeling used to be to model ten rainfall patterns for each thing you’re designing. And just this year this was upgraded to twenty, so this is like doubling the amount of human labor and computational work that’s going into modeling for these sorts of water infrastructures.
So what’s critical here is that at best we only have about 150 years of rainfall data. Much less in some regions. And this is being taken from a stable, predictable climate. At the heart of this sort of engineering is an assumption that past rain is a good indication of future rainfall, of future weather. What happened at Oroville is outside of what the historical data would have indicated could have happened. They got a lot more rain because their model said that this would fall as snow rather than rain in the catchment. And so calling Oroville an engineering failure is actually not accurate because it’s also a failure in our ability to predict climate.
So the work of a water engineer’s become increasingly difficult as precipitation data drawn from a stable climate is becoming less and less indicative of things to come. And the stakes are high. If you look around you’ll notice that all of our infrastructures, our dams, our culverts, but also our media and computational technologies, are specifically calibrated to stable conditions of the past 12,000 years. And climate change promises to decouple us and these systems from their climactic niches. Even with the rapid advance of computation, climate destabilizing is increasing the entropy of our system and reducing our capacity to predict it. And with all of our technologies, we need to be considering their increasing energy demands and their climate affordances. Thank you.
